
In this guide, I’m going to cover the process of creating a Linux server to visualize a lot of the network telemetry (statistics) that the Cisco Catalyst 9800 offers. Network telemetry can include client statistics, access-point statistics, network statistics and controller statistics. All of these tools are open source, and free for personal use. The principles covered here should apply to a lot of other Cisco networking hardware (IOS-XE, IOS-XR) as well.
You don’t need a very robust Linux server to handle this task. In fact, it could probably be done on a Raspberry Pi. I’m going to use an Ubuntu Server 18.04.3 LTS Virtual Machine with 1 vCPU, 2GB of RAM and an 80GB HD (it won’t need nearly that much disk space, but I don’t want to run out in the future). You will not need a desktop environment, so installing the “server” version of Ubuntu will allow the resources to be used for computing the telemetry.
I am not going to cover the process of installing Linux, because there are plenty of guides out there if you haven’t done it before. I’ll pick up the process immediately after the installation of the operating system finishes.
I should make it clear that I am not an expert when it comes to yang models and database queries (we’ll be spending a bit of time with each of them throughout this process). However, I’ve managed to make this work well enough for my purposes, and I wanted to show what you can accomplish with a couple hours of work. I intend to update the guide as I learn more, and I welcome comments on how this could be done in new and different ways.
Table of Contents
Some examples of what you can see from the Telemetry data
Here are a few examples of the telemetry I’ve visualized in my own test environment. I will cover the steps to generate each of these graphs.
Setting up Linux for receiving and visualizing the telemetry
In order for Linux to be able to receive and visualize the telemetry, we need to install a few services. We are going to install Telegraf, InfluxDB and Grafana. Telegraf will receive the network telemetry and send the data to InfluxDB. Grafana will be used to visualize the data that is stored in InfluxDB.
You may be familiar with a “TICK stack” which includes Telegraf, InfluxDB, Chronograf and Kapacitor. What we’re building will be very similar, but doesn’t include Chronograf or Kapacitor because they aren’t necessary at this stage. Some folks refer to what we’re setting up as a “TIG stack.” Note: There are docker containers that exist with a complete TICK stack, and it may simplify the installation considerably. However, I wanted a more scalable solution that could be used for other purposes down the road, so I installed each piece individually.
Since we’re picking up this process from a fresh operating system installation, the first thing you should do is update the OS packages.
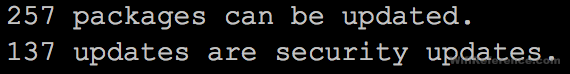
Issue a “sudo apt update” and “sudo apt upgrade” to bring the OS packages current. Depending on the speed of your system, this may take a while. Once everything is upgraded, we can proceed with the installation.
Installing InfluxDB
First, add the Influxdata repository:
echo "deb https://repos.influxdata.com/ubuntu bionic stable" | sudo tee /etc/apt/sources.list.d/influxdb.listImport the apt key:
sudo curl -sL https://repos.influxdata.com/influxdb.key | sudo apt-key add -Update apt and install InfluxDB:
sudo apt-get update
sudo apt-get install -y influxdb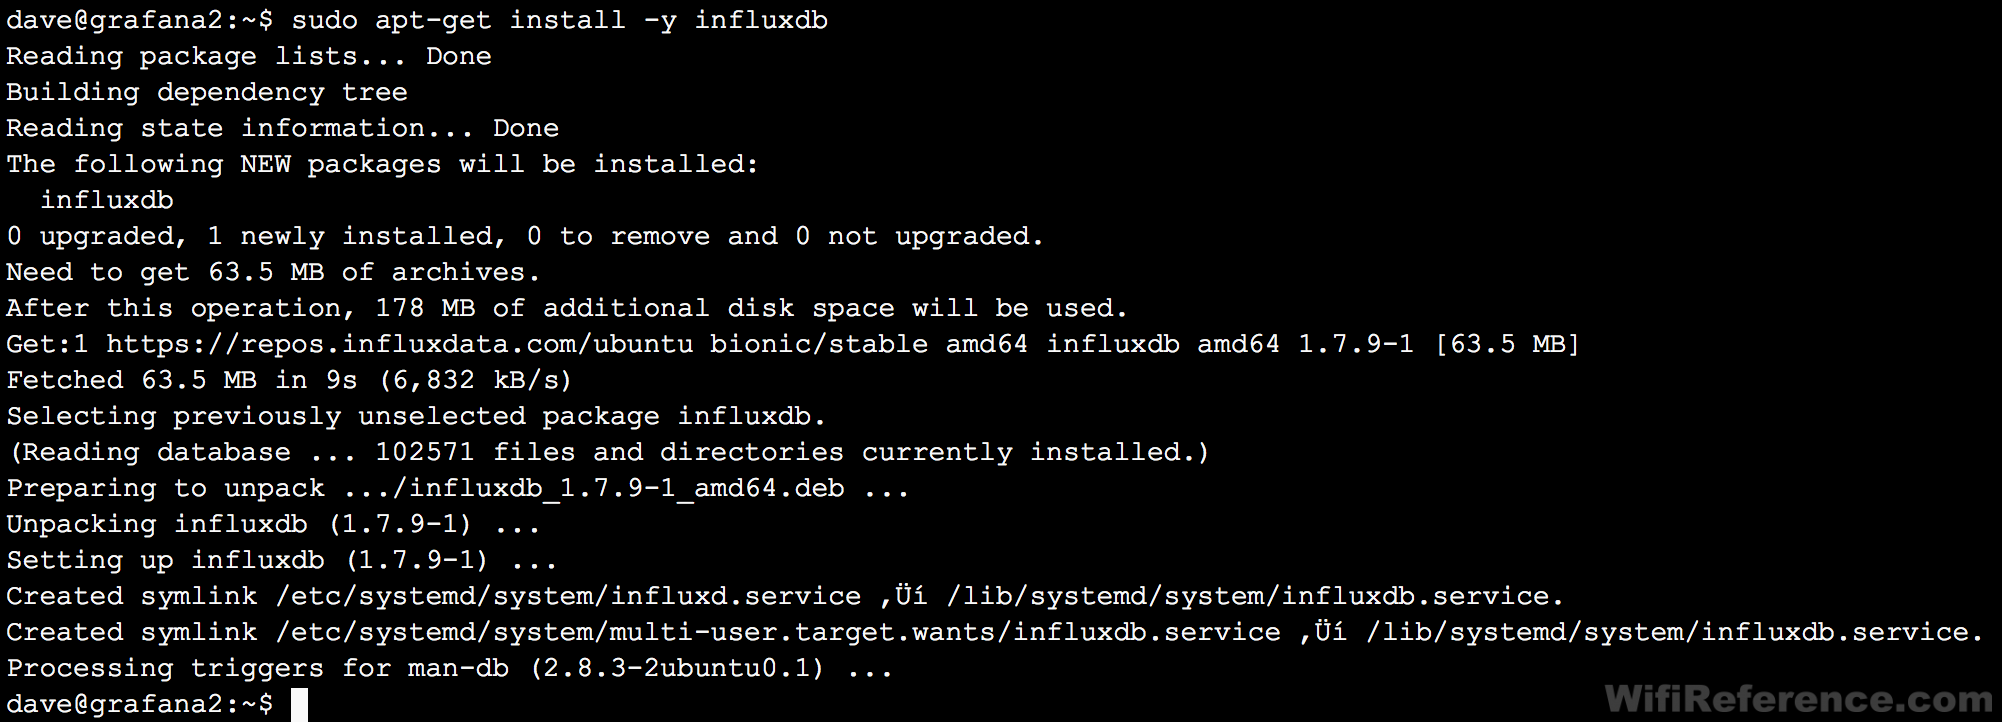
Enable InfluxDB to run at startup:
sudo systemctl enable --now influxdb
sudo systemctl is-enabled influxdb
Check the status of InfluxDB (make sure it says it is active):
sudo systemctl status influxdb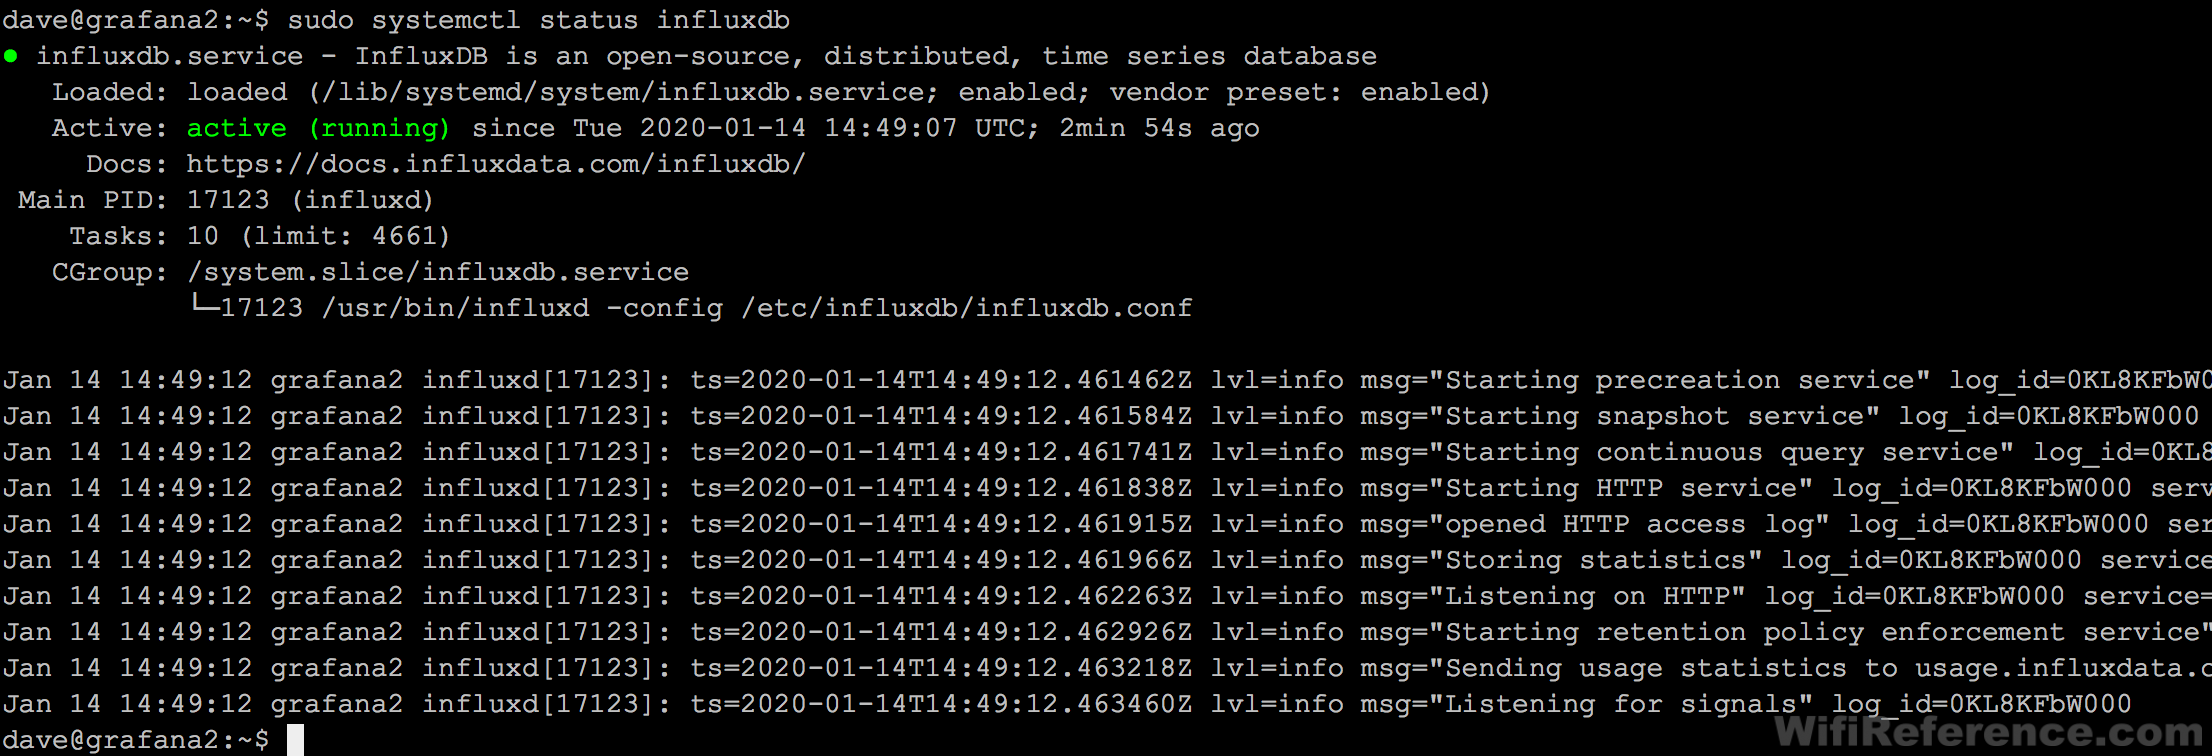
Now we need to create the database and give it credentials:
influxThis should connect to the newly created database server on port 8086. We will now create a database called “telegraf”, with a user/password combination of “telegraf/wifireference.”
create database telegraf
create user telegraf with password 'wifireference'
Then check to make sure the database and users were created:
show databases
show users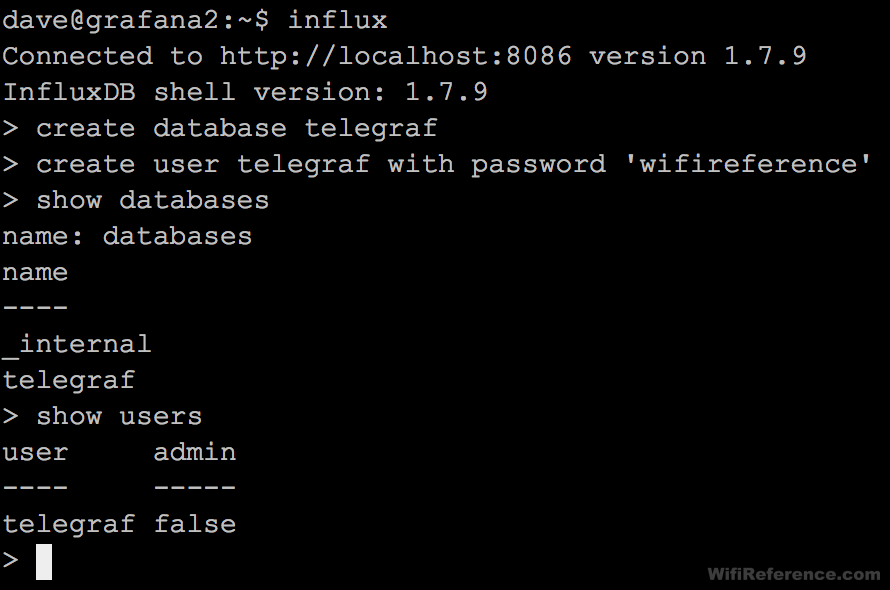
Install Telegraf
Since we just installed InfluxDB, we already have the Influxdata repository setup. We can simply just add the package for Telegraf:
sudo apt-get -y install telegraf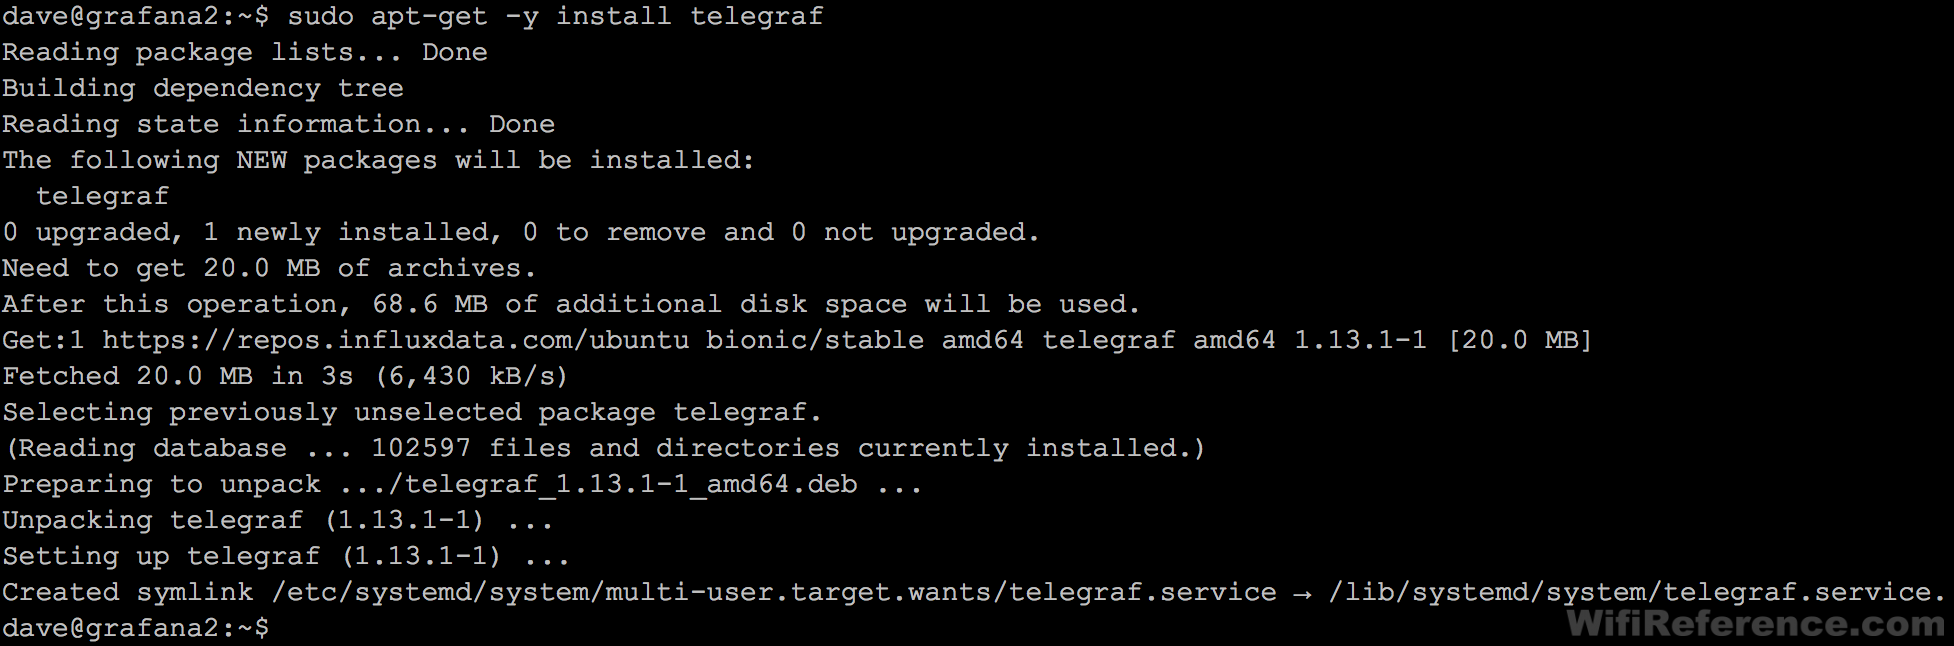
Note: You need to be at a fairly recent version of Telegraf to include the “cisco_telemetry_mdt” plugin, which is required for our purposes. At the time of this writing, the repository includes Telegraf v1.13.1, which includes the plugin.
Now we must ensure that Telegraf is enabled at startup:
sudo systemctl enable --now telegraf
sudo systemctl is-enabled telegraf
Check the status of the service and make sure it is active:
systemctl status telegraf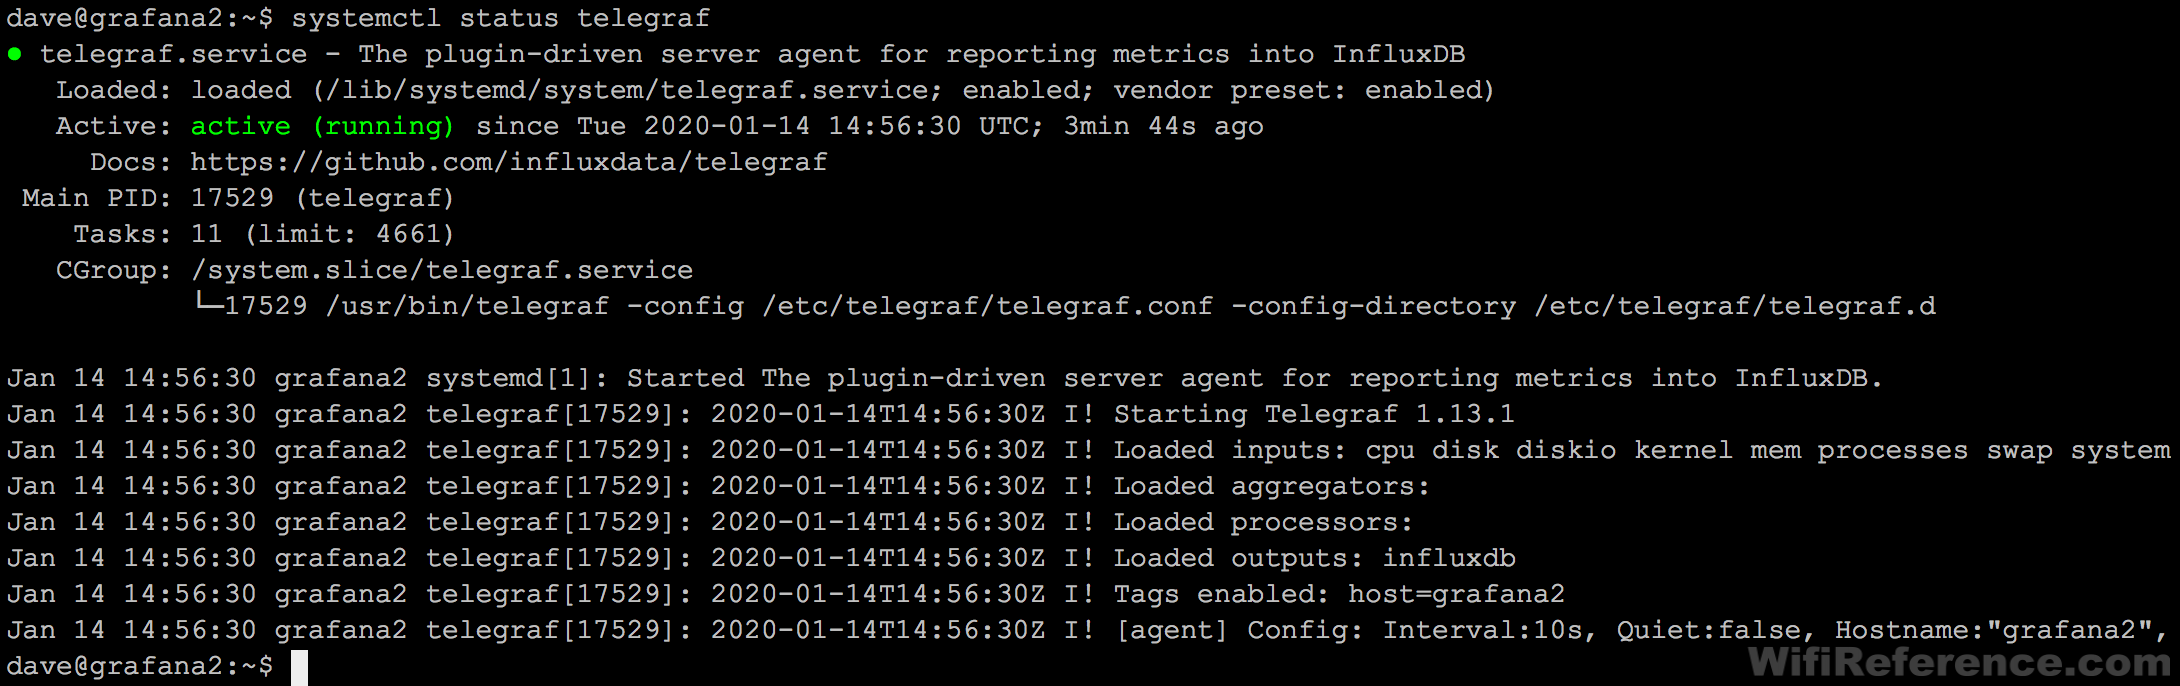
Install Grafana
First, add the GPG key for the Grafana repository:
wget -q -O - https://packages.grafana.com/gpg.key | sudo apt-key add -Then add the Grafana repository:
sudo add-apt-repository "deb https://packages.grafana.com/oss/deb stable main"Update apt and install Grafana:
sudo apt update
sudo apt install grafana
Start the Grafana service:
sudo systemctl start grafana-serverCheck the status of the Grafana service and make sure it is active:
sudo systemctl status grafana-server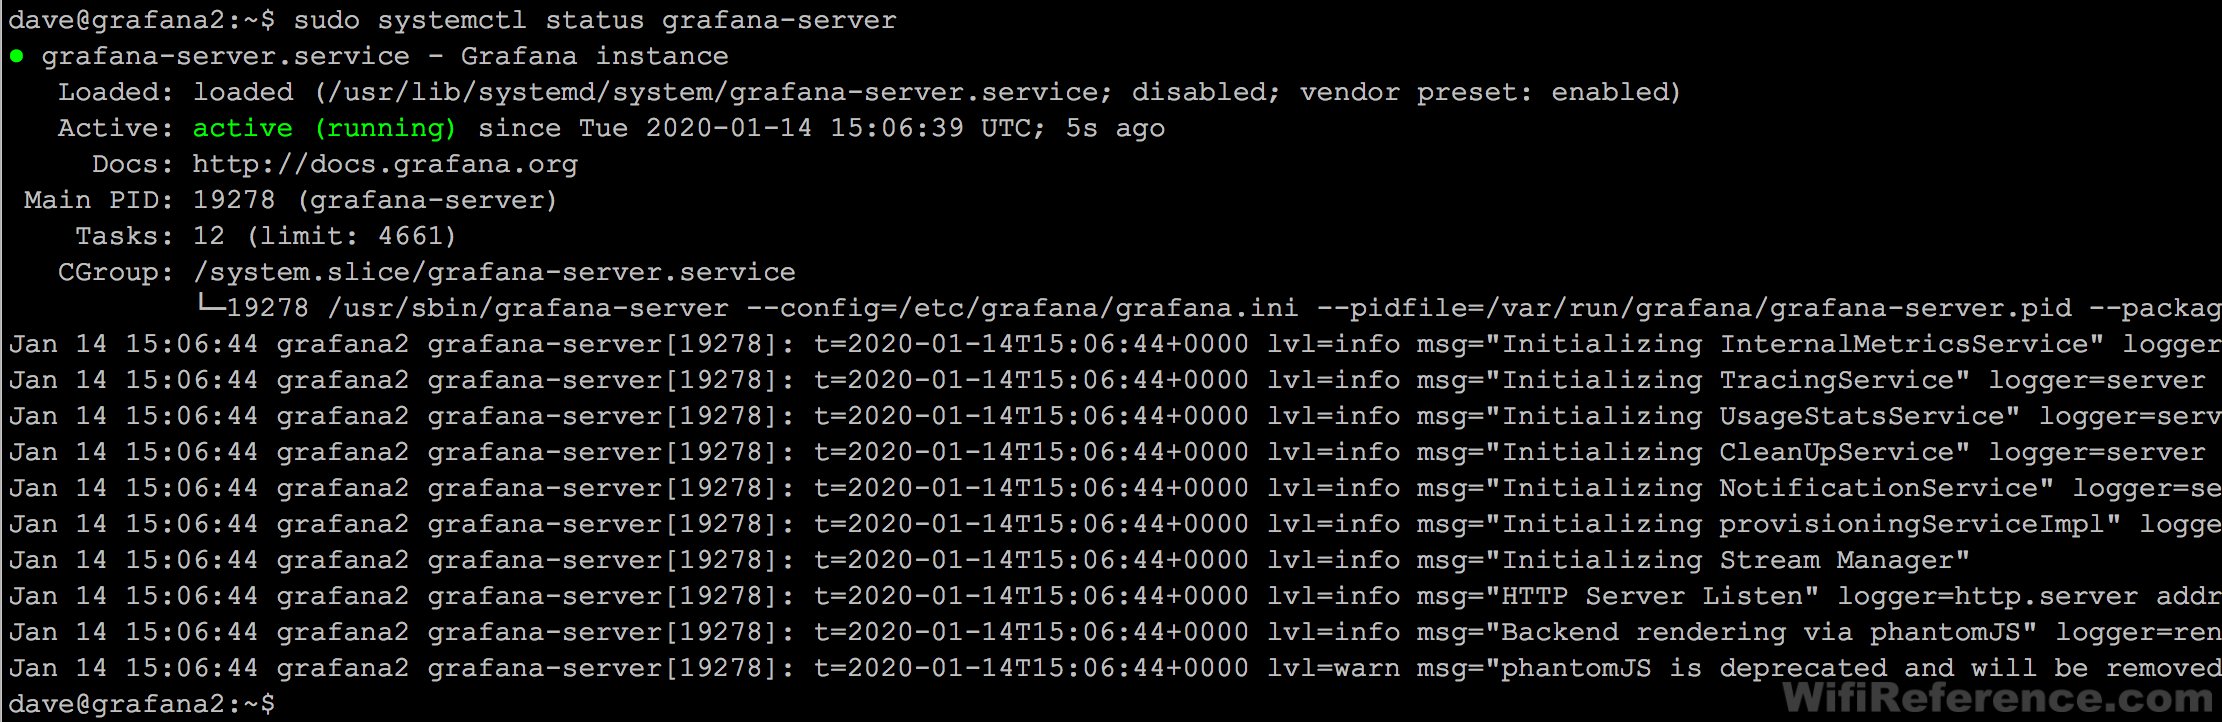
Now make sure the Grafana service runs at startup:
sudo systemctl enable grafana-server
You should verify that you can access the Grafana dashboard at http://[server ip]:3000
Login with User: admin, Pass: admin, and it will ask you to change the password.
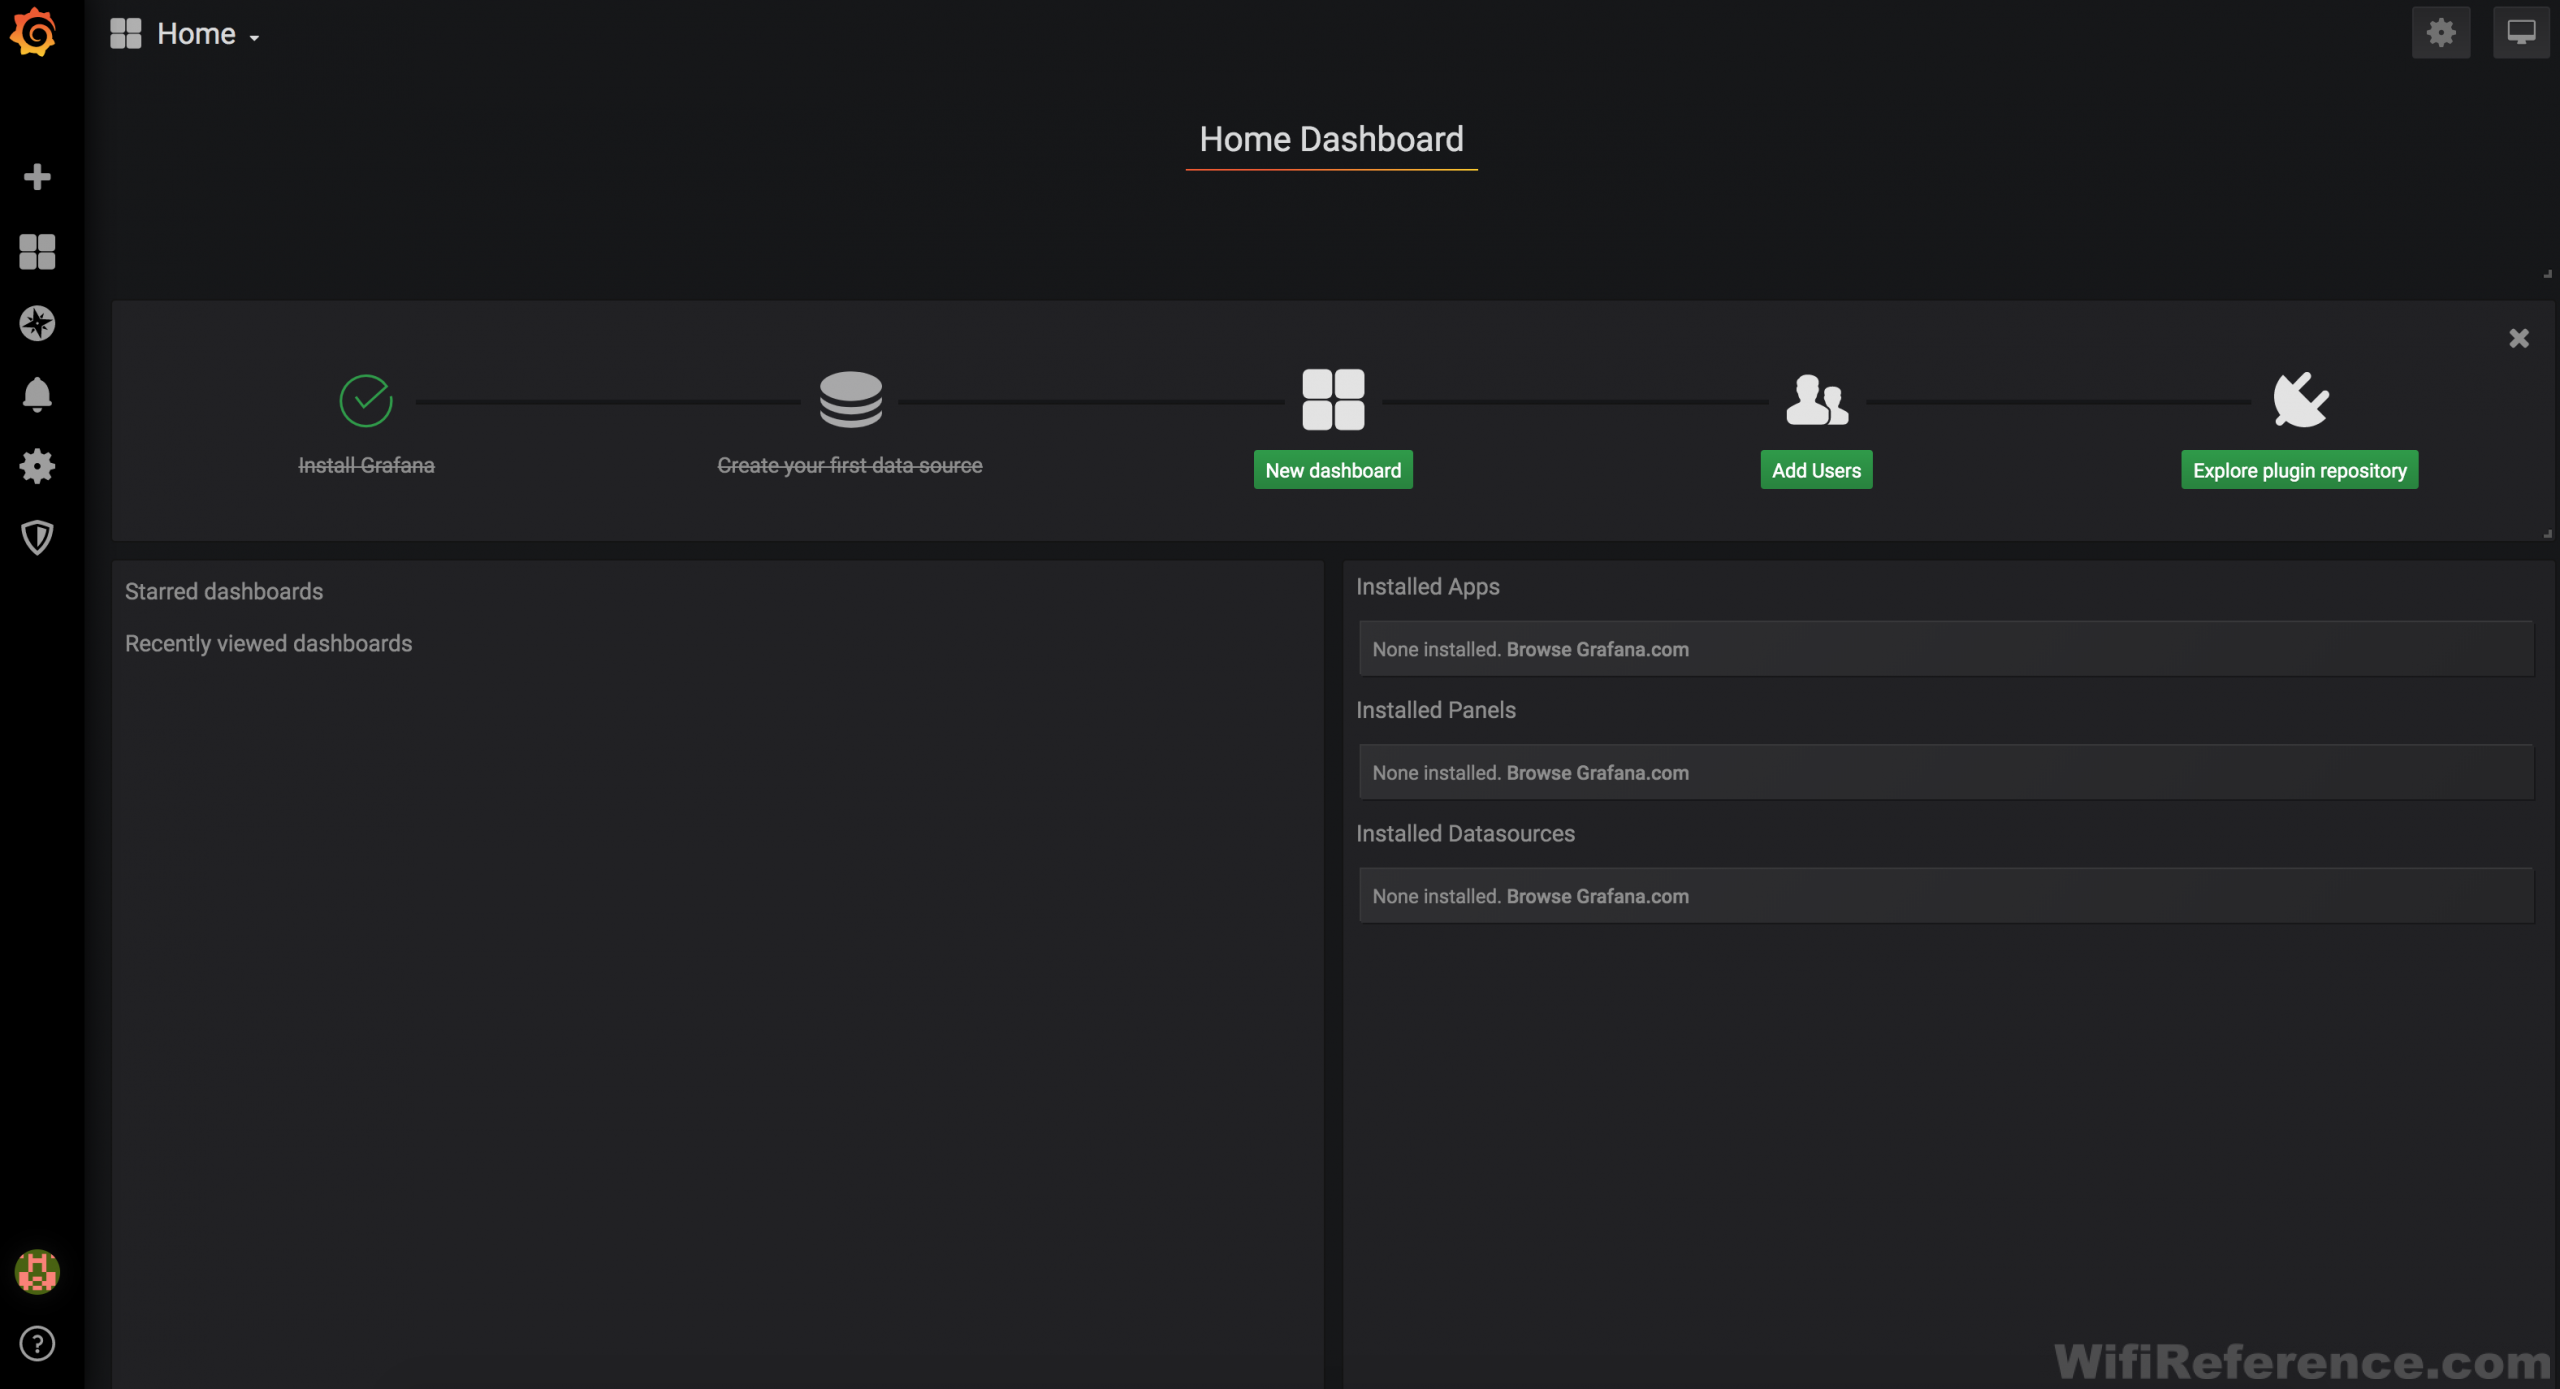
At this point, you should be presented with the main Grafana dashboard.
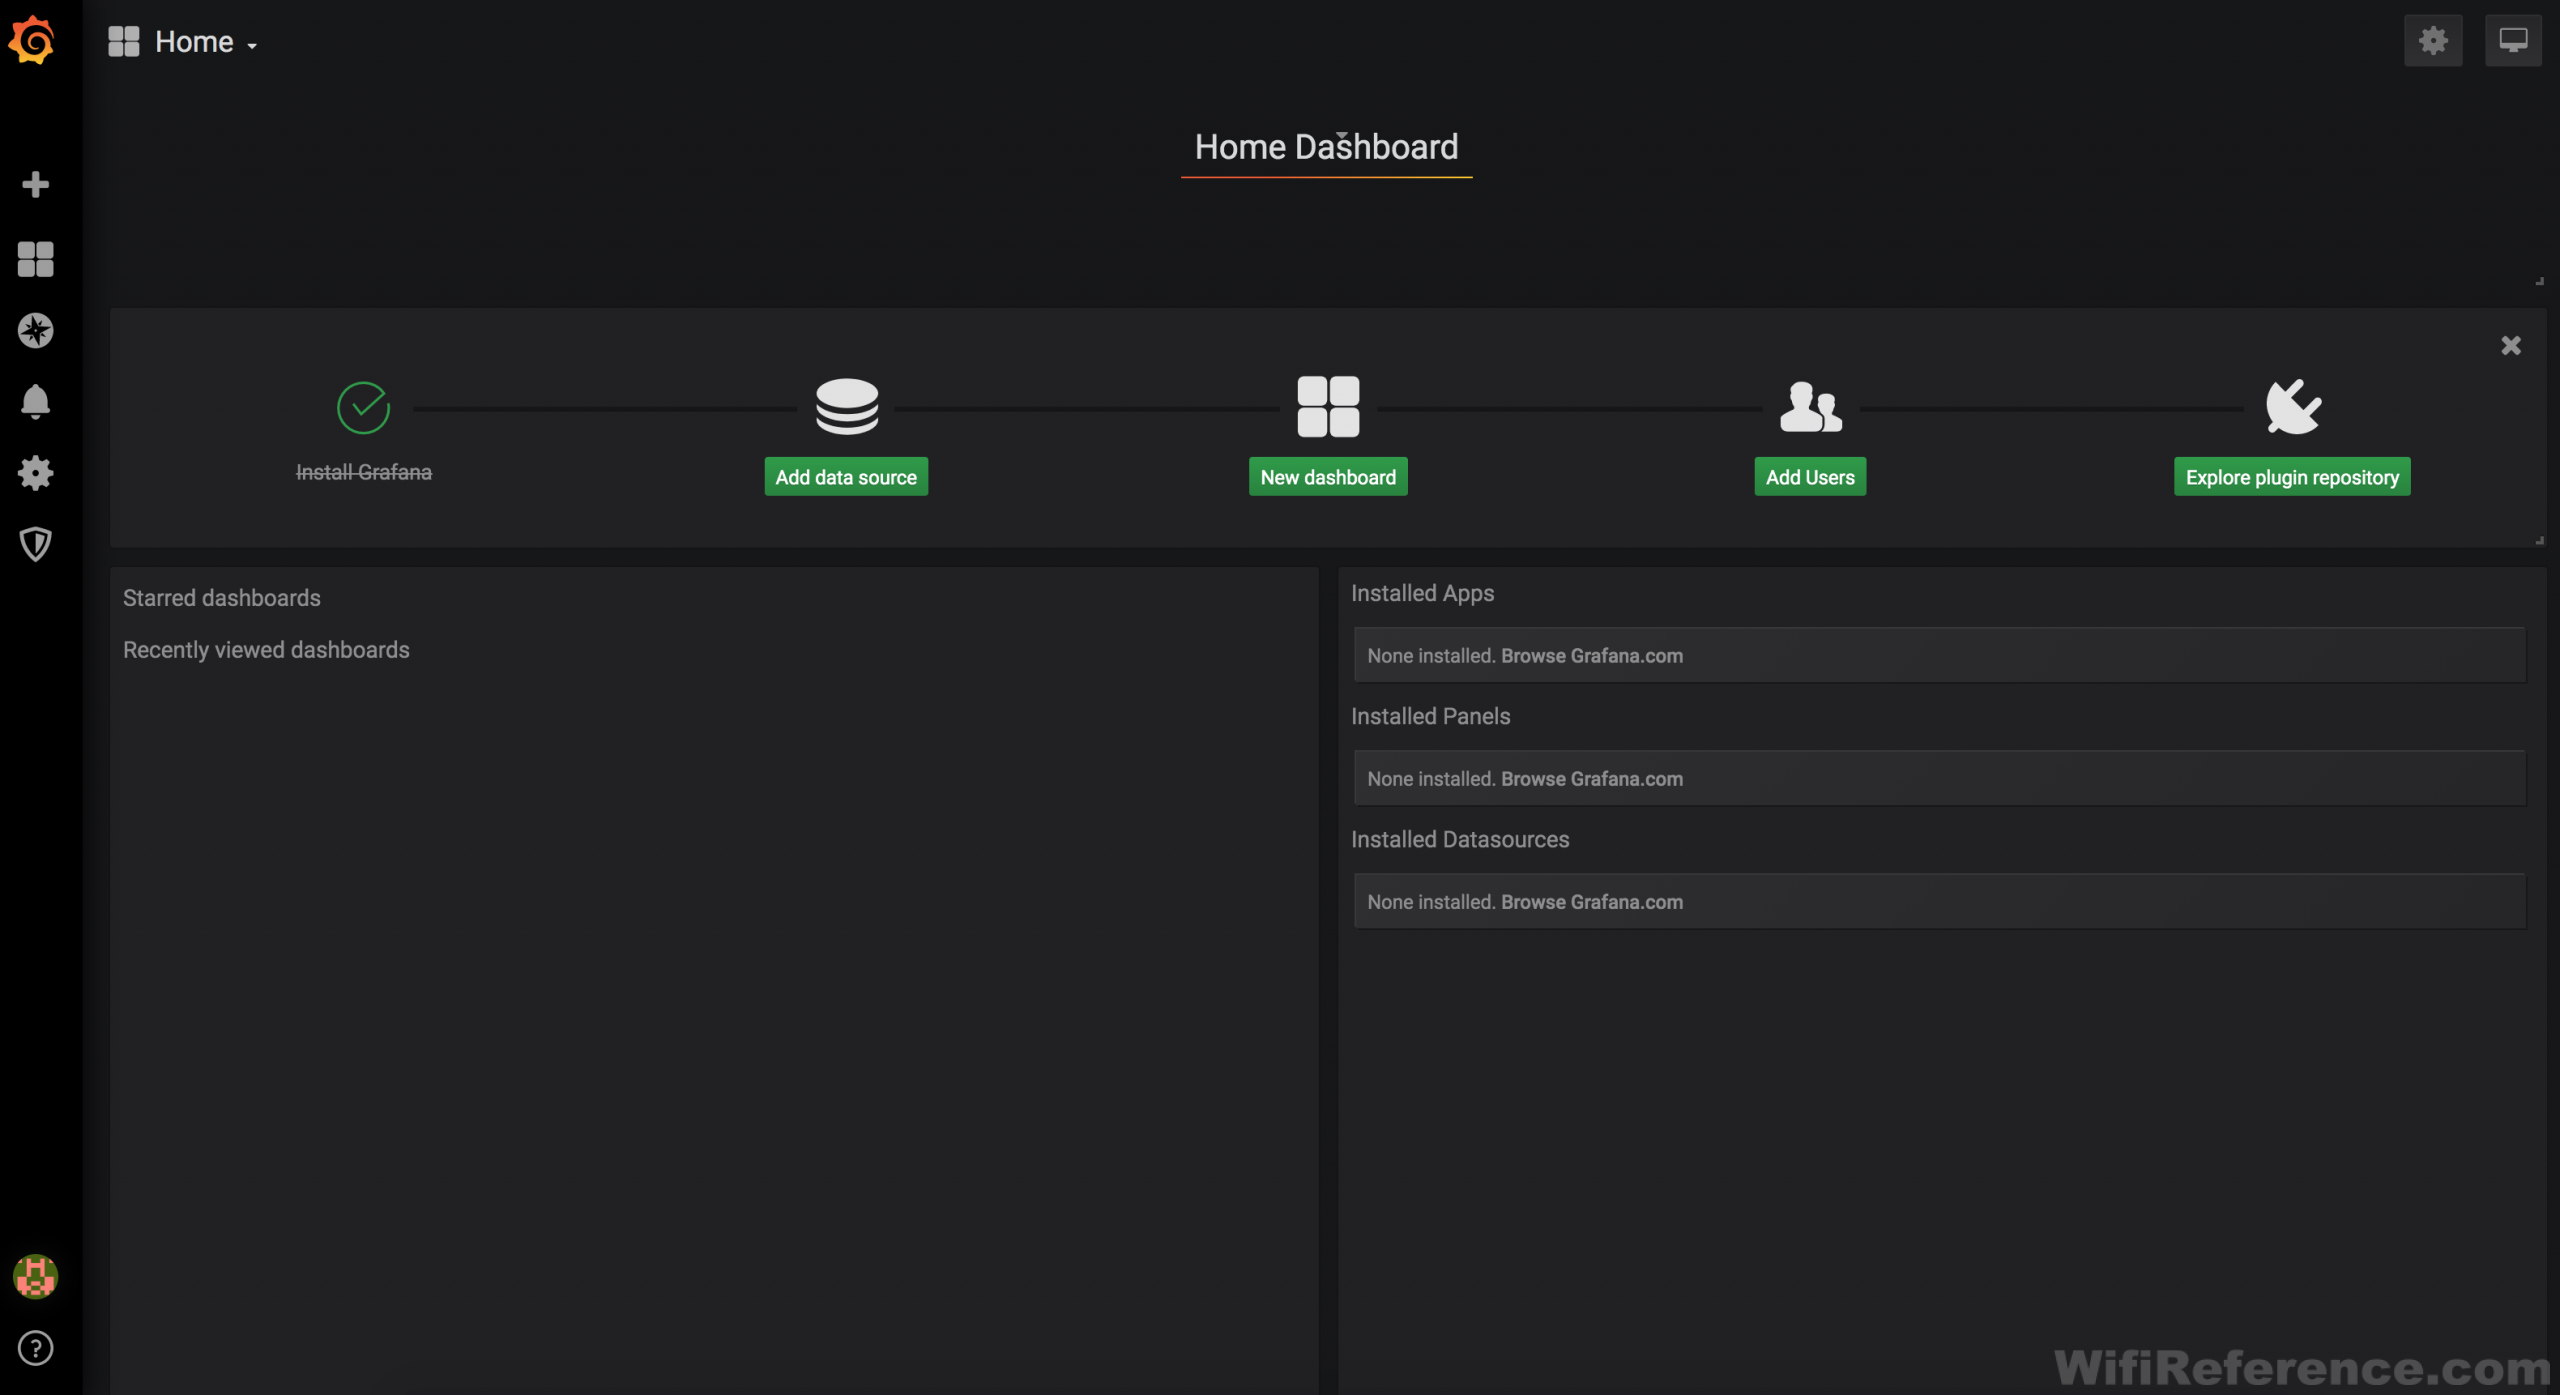
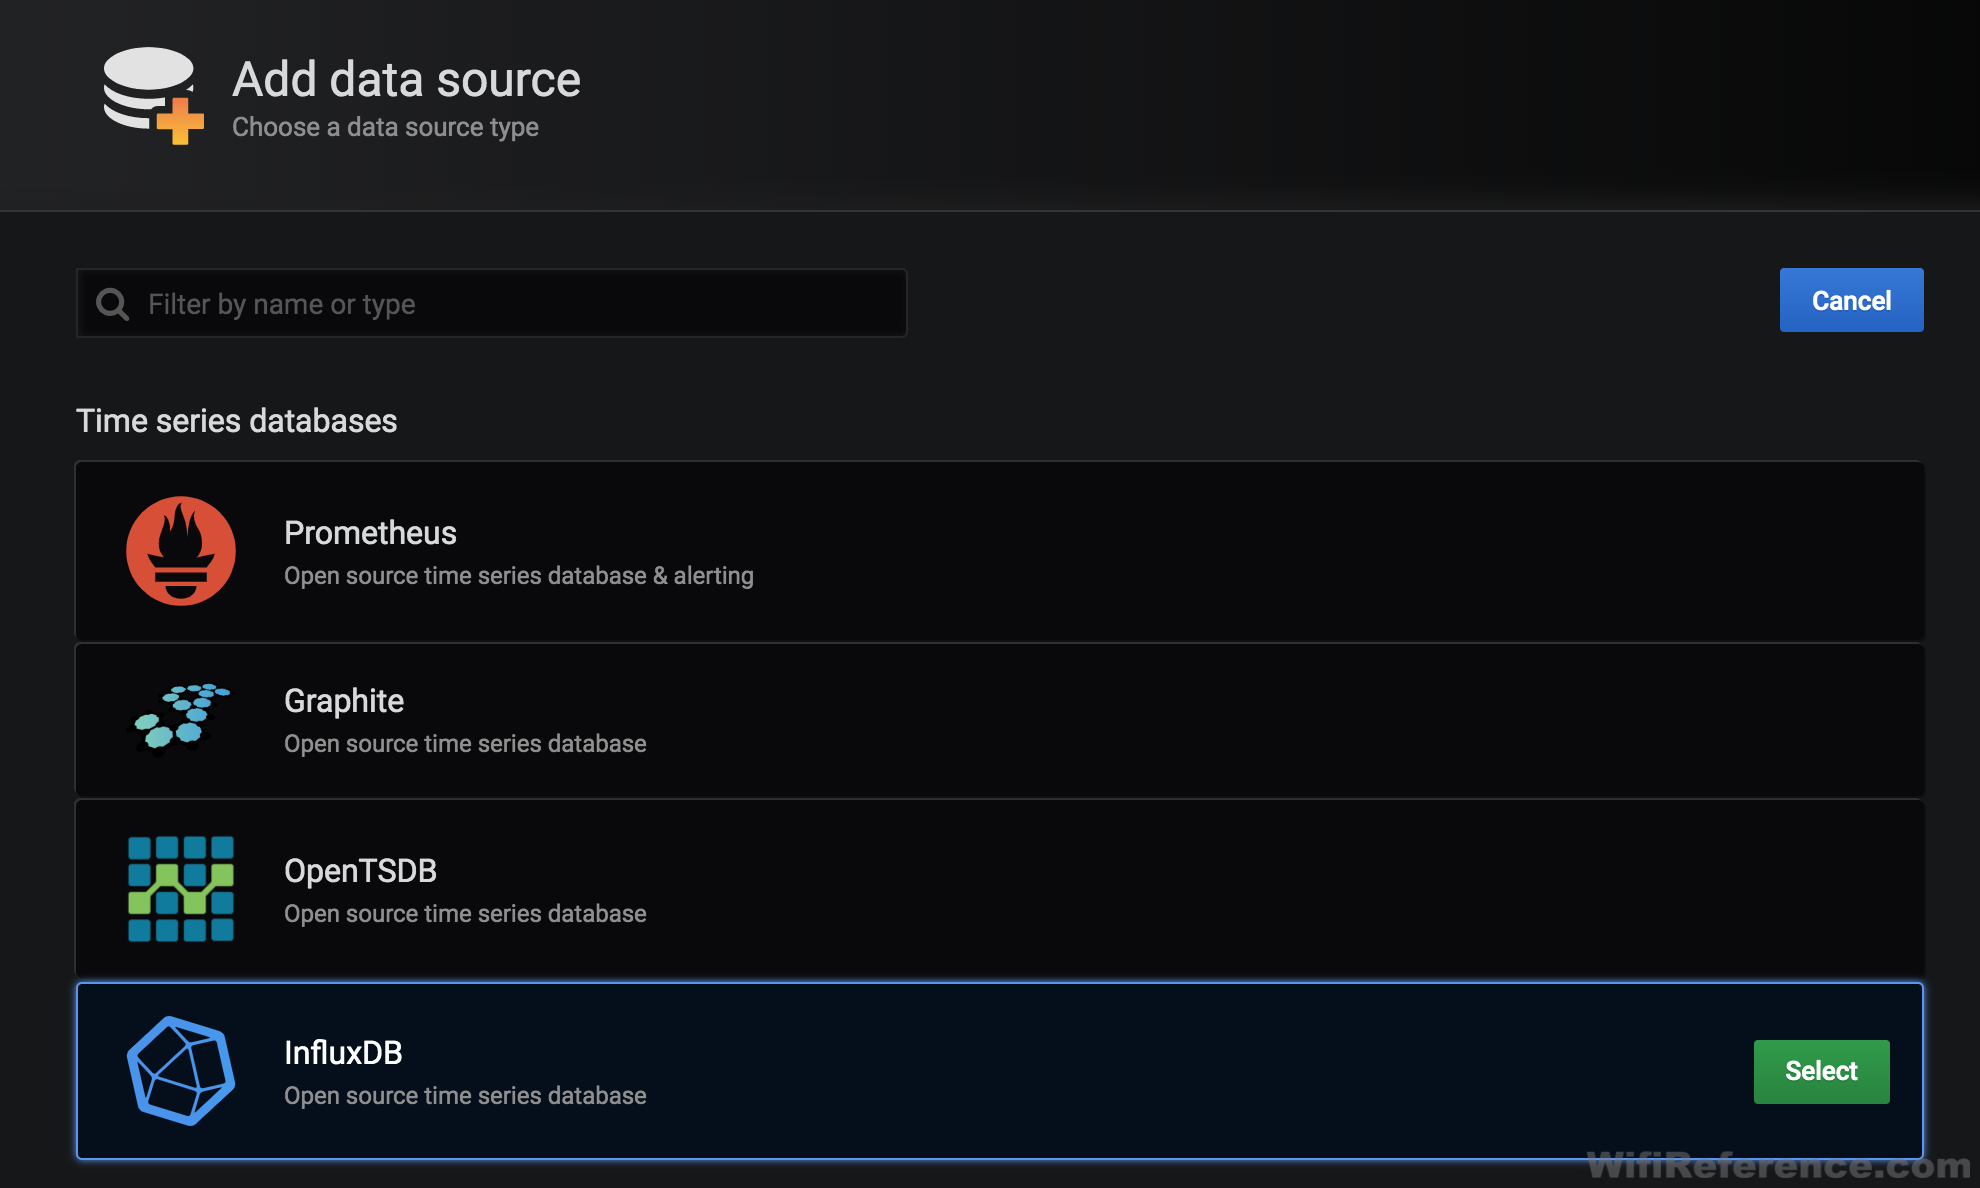
We need to configure InfluxDB as the data source. Click the “Add data source” button on the dashboard and then select “InfluxDB” as the database:
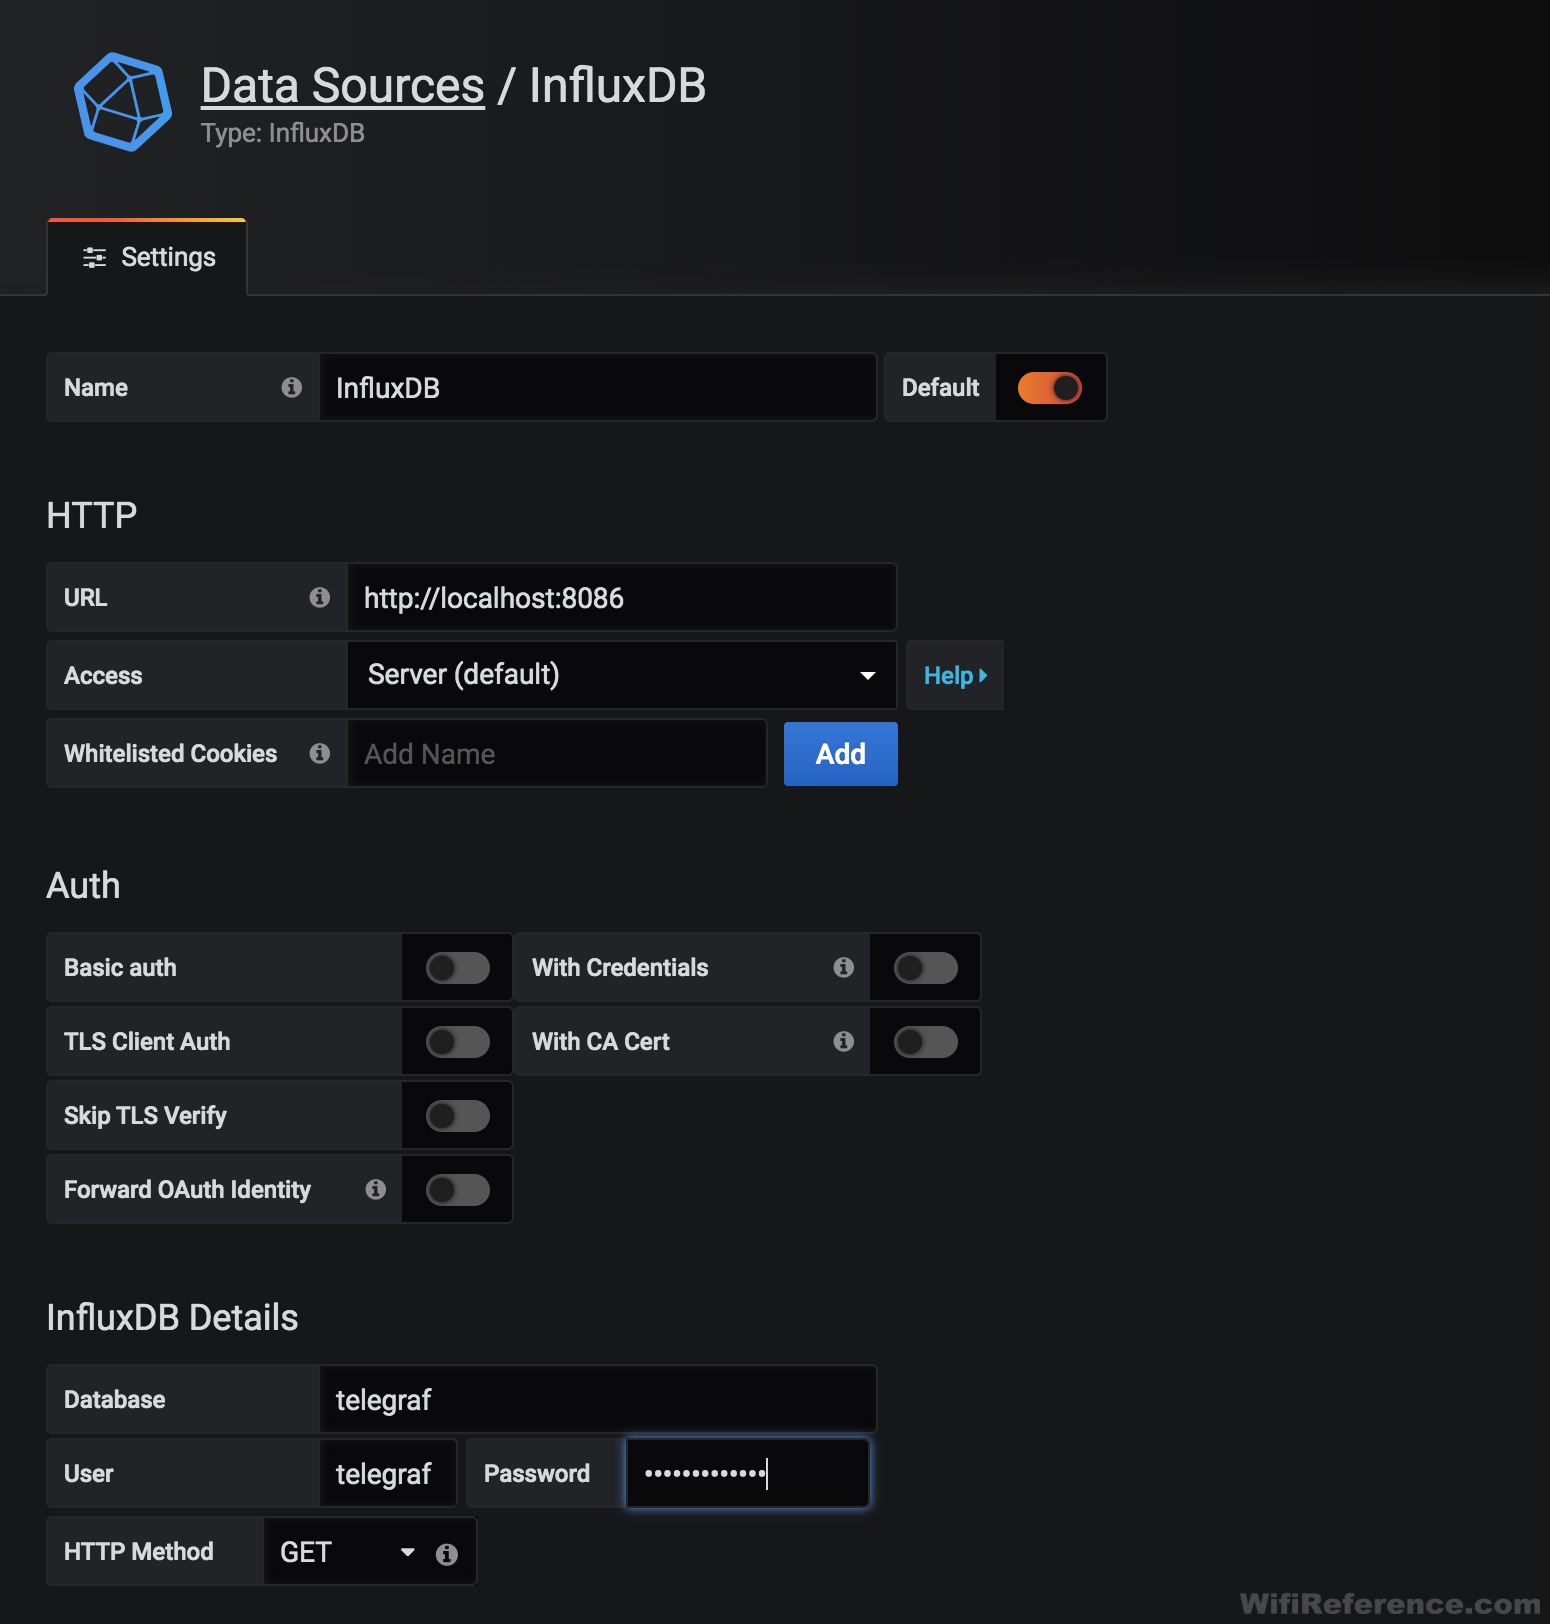
You can leave most of these options at the defaults, but a few things need to be configured:
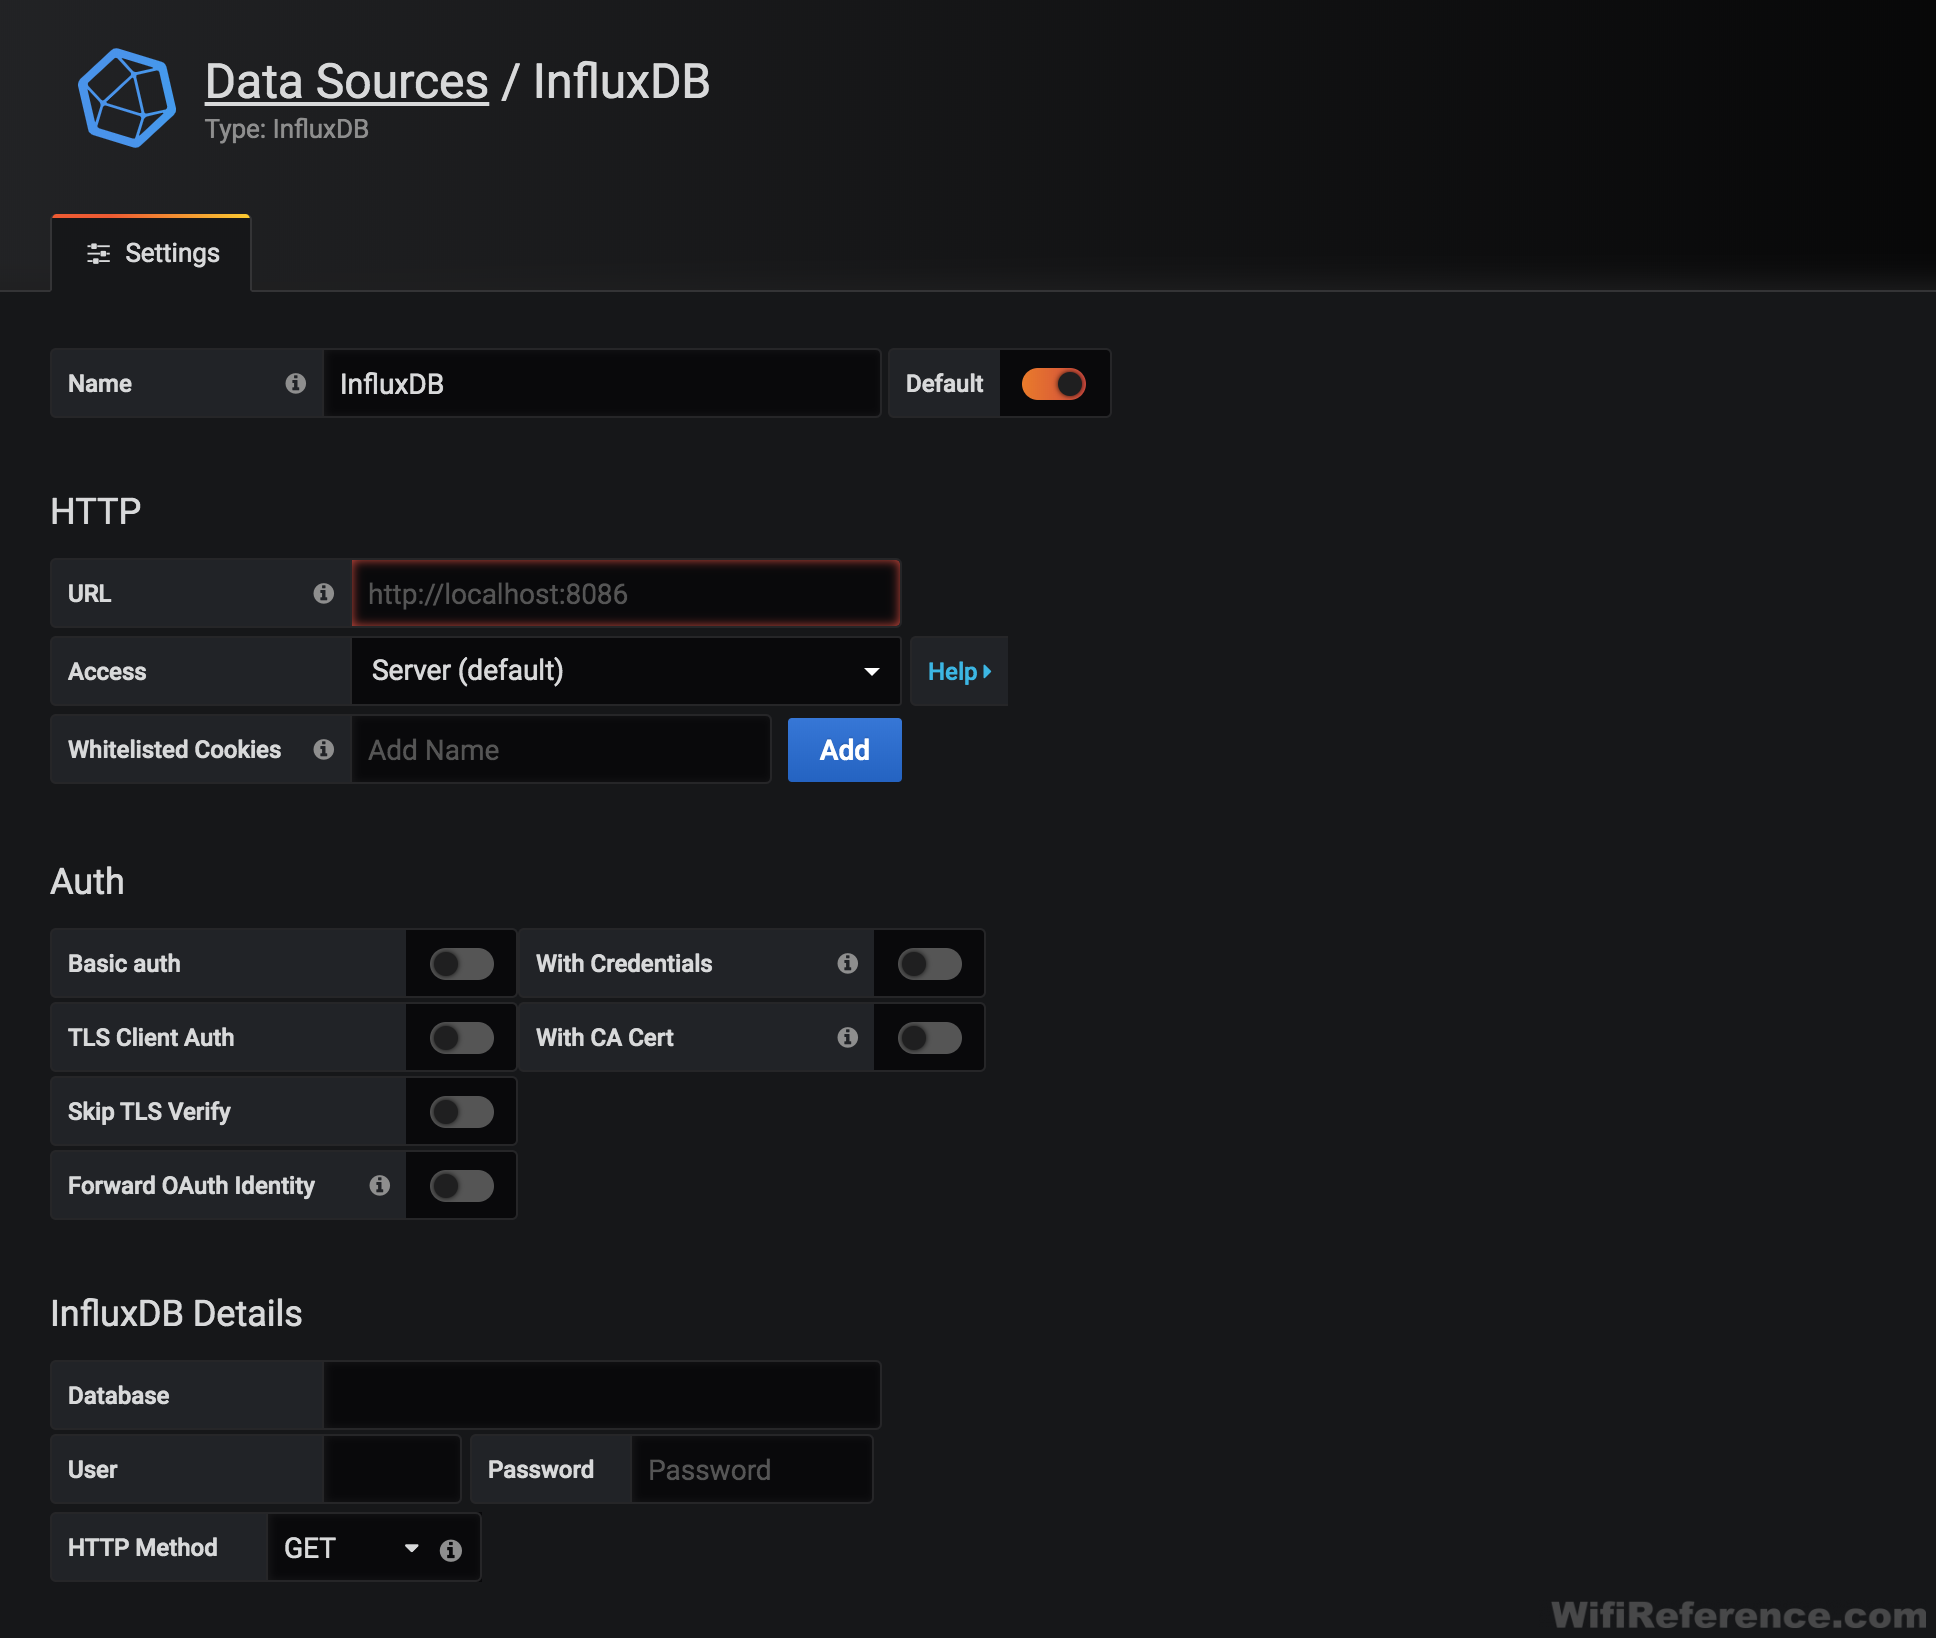
We need to configure the URL, Database name, User and Password. The URL should be http://localhost:8086. The database name and credentials should match what you used in the InfluxDB installation steps above:
Scroll down and click the “Save and Test” button. You should see a banner similar to the following:

Configure Telegraf to receive Cisco Network Telemetry
We need to edit the Telegraf configuration file, so that it will receive telemetry information from the Catalyst 9800. Use your linux editor of choice. My example will show the steps with “vi.”
sudo vi /etc/telegraf/telegraf.confWe must add the necessary information to enable the “cisco_telemetry_mdt” Telegraf plugin. We need to add a few lines of code to the Service Input Plugins section of the file. First, lets navigate to that section of the file:
/SERVICE INPUT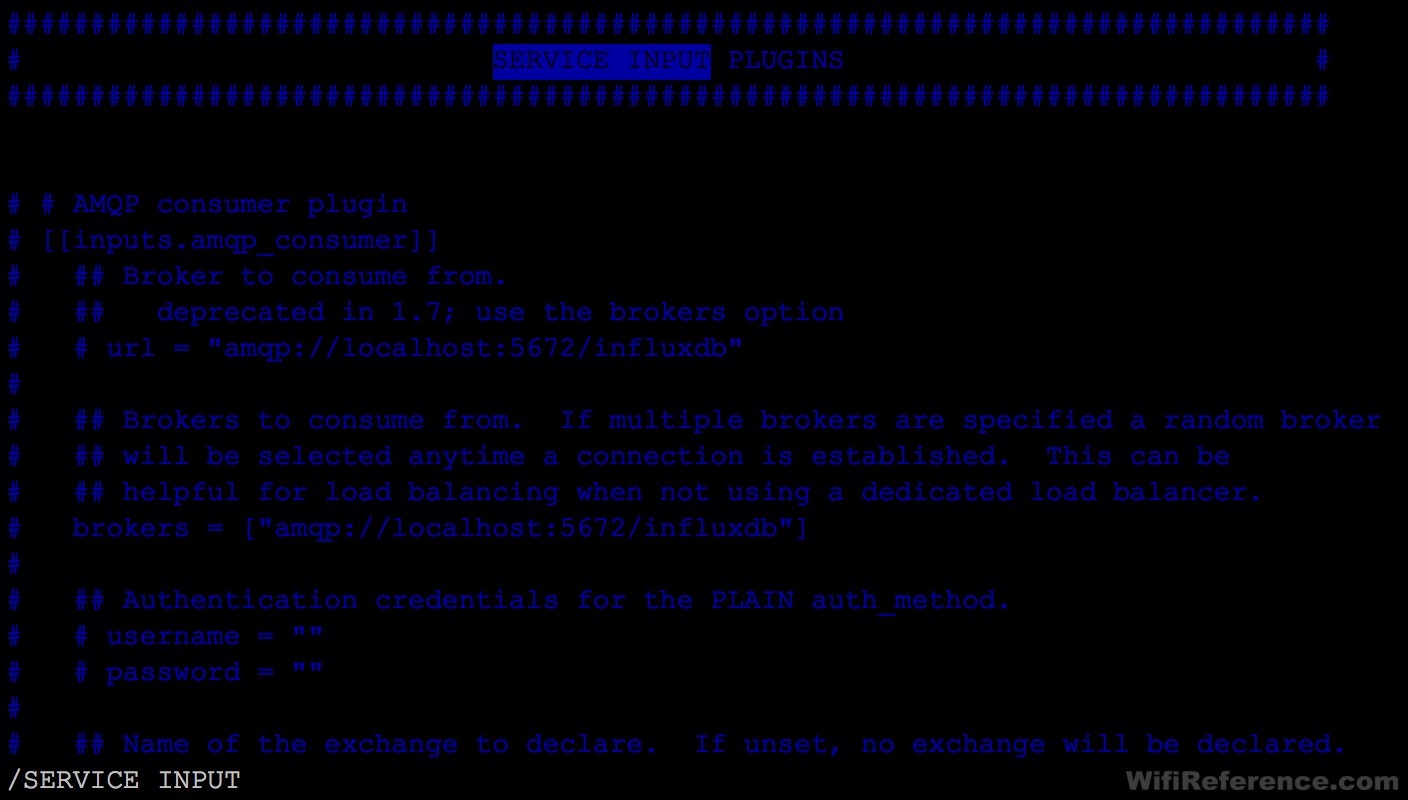
We will add the following Telegraf plugin lines just inside this section:
[[inputs.cisco_telemetry_mdt]]
  transport = "grpc"
  service_address = ":57000"
 [inputs.cisco_telemetry_mdt.aliases]
   ifstats = "ietf-interfaces:interfaces-state/interface/statistics"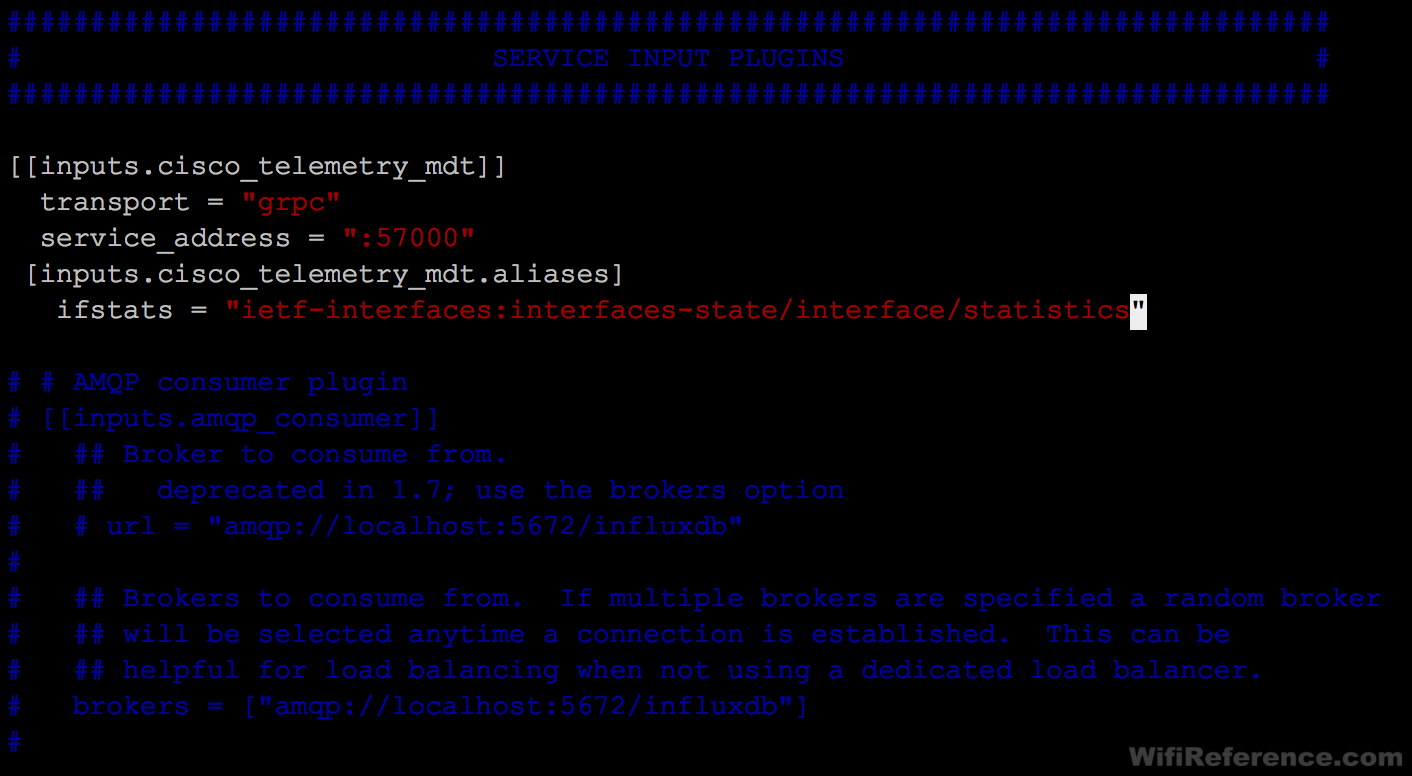
We also need to configure Telegraf to connect to the InfluxDB that we created earlier:
/OUTPUT PLUGINS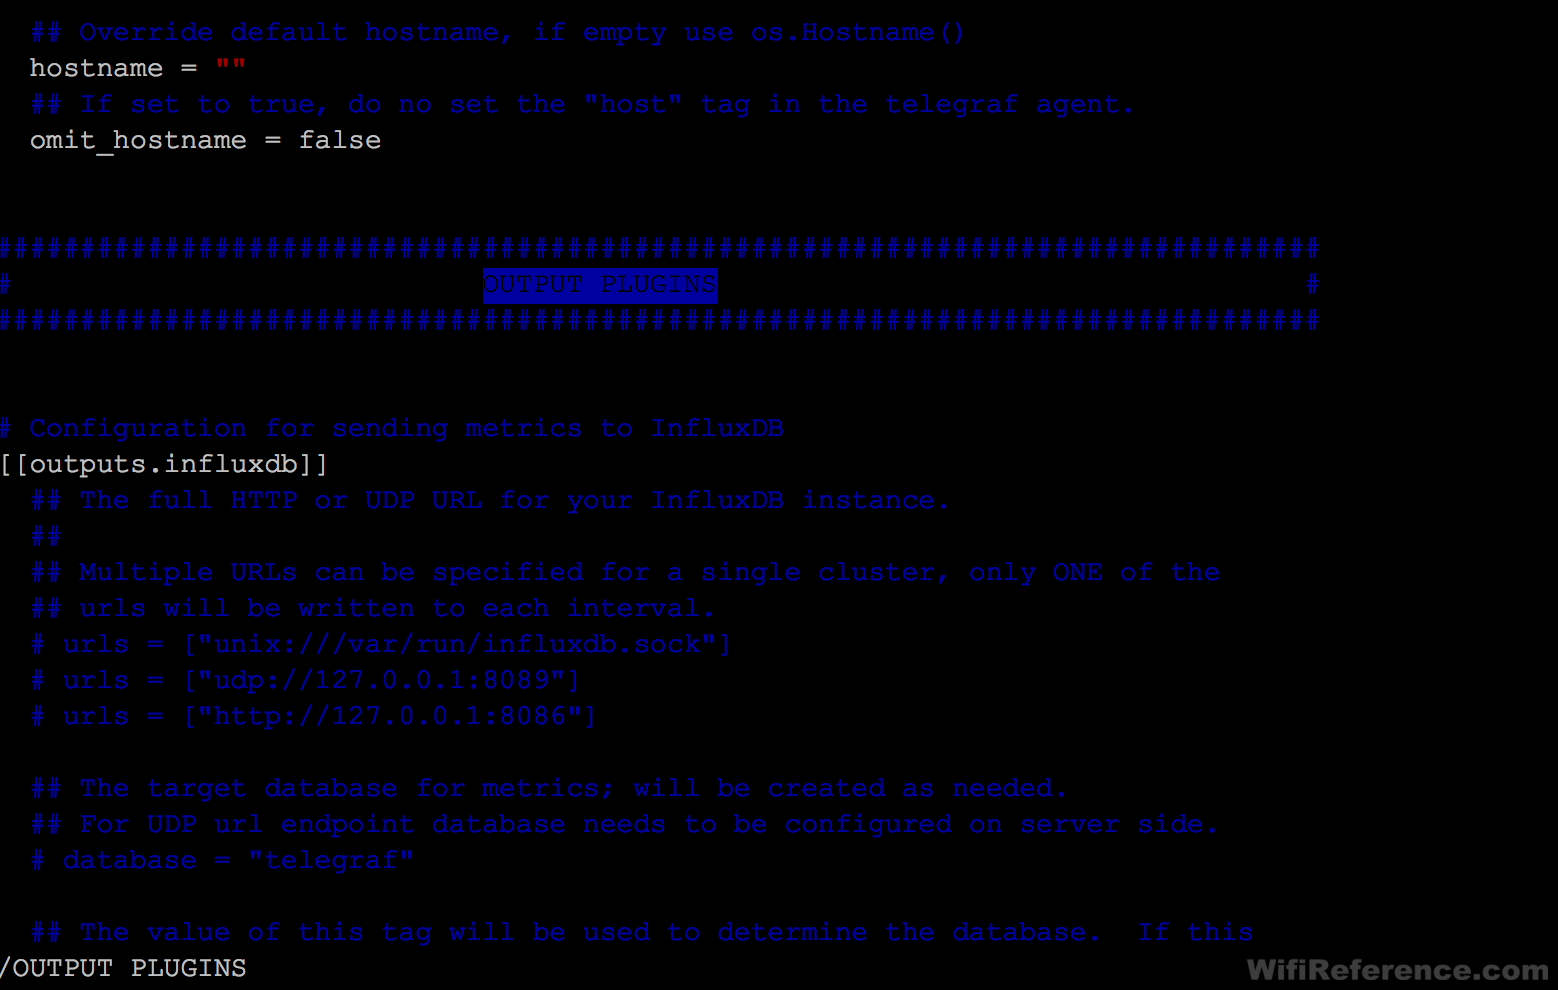
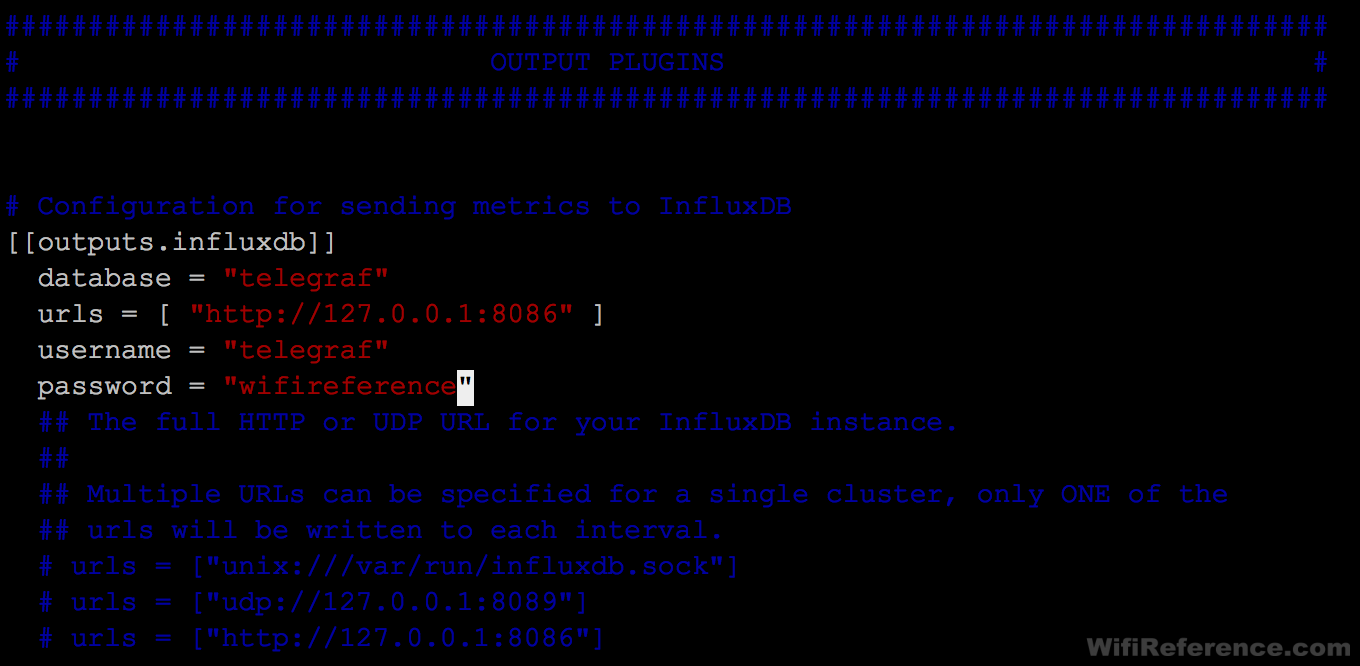
We must add configuration to represent our InfluxDB. Note that the section header [[outputs.influxdb]] already exists. We are adding 4 lines of configuration beneath that header:
# Output Plugin InfluxDB
[[outputs.influxdb]]
  database = "telegraf"
  urls = [ "http://127.0.0.1:8086" ]
  username = "telegraf"
  password = "wifireference"
When complete, that section of the file should look like this:
Save the file and restart Telegraf:
sudo systemctl restart telegrafMake sure the Telegraf service restarted (it will fail if it doesn’t like the changes to the configuration file):
sudo systemctl status telegraf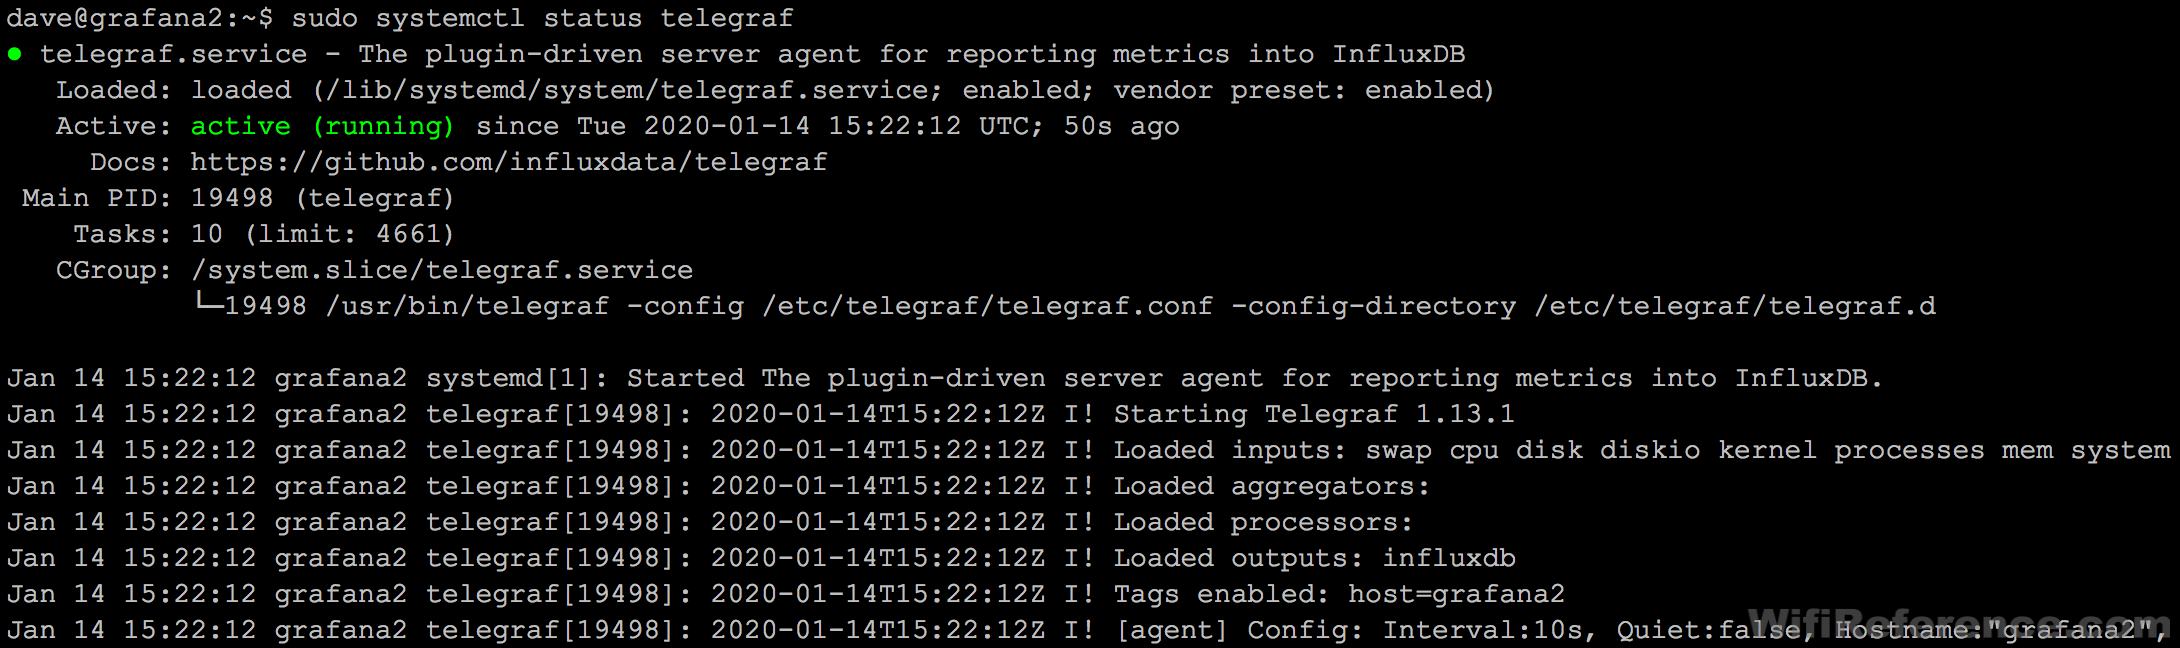
Now make sure the server is listening on port 57000 (the telemetry port we configured in the telegraf.conf file):
netstat -tulpn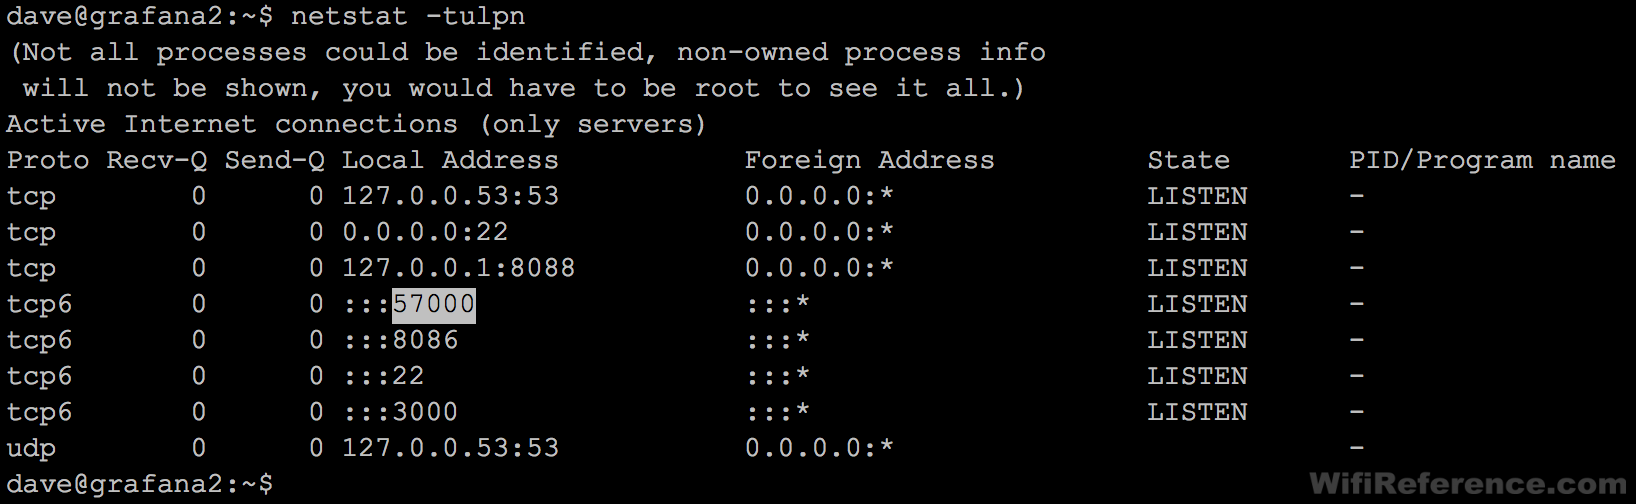
Congratulations! You’ve configured Linux to listen for telemetry from the 9800. Now we can move on to the telemetry configuration in the Catalyst 9800 itself.
Configuring the Catalyst 9800 to stream Network Telemetry to Telegraf
This portion is fairly straight forward, once you have the commands (which I will provide below) to get the data you are looking for.
Cisco’s model-driven telemetry is provided by “subscriptions.” You subscribe to a particular metric category that you want to send to the receiver. Because I’m not an expert with yang models, I struggled to find some of the statistics that I was interested in seeing. I’ll show you the method I used to find the metrics (there must be a better way, but I couldn’t find one).
I’ll also give you a list of all of the telemetry subscriptions that I used to get the metrics I am referencing in this article. Some of these subscriptions could likely be summarized, and some are probably not currently being graphed. Thankfully, InfluxDB is robust enough to deal with a ton of data being thrown at it, so I will provide everything I am using and you can clean out the sections you aren’t interested in.
Finding the metrics
The statistics or metrics that you will want to visualize, are organized in a yang model. The yang model is basically a standard way of organizing information into a hierarchy, and you will need to reference the entire hierarchy/path when you subscribe to a group of metrics.
First, you will want to obtain the yang models for IOS-XE devices. The yang models can be found here: https://github.com/YangModels/yang. It’s easiest to download the entire bundle, and then just navigate to the IOS-XE files. Note: These models are version specific, so you should make sure you are referencing the files for the version you are working with. I will be referencing the IOS-XE 17.1.1 files.
Within the Yang model bundle, the files we are interested will be located in the following location: /vendor/cisco/xe/1711 (for version 17.1.1). You can look in the 16121 folder for version 16.12.1.
Within that folder, you will notice a ton of files. The ones we are interested in start with the filename “Cisco-IOS-XE-wireless,” and we will be working with the “oper” files, as we are simply pulling statistics, not modifying configuration.
If you’ve never worked with Yang models before, you’re probably looking at this pile of files and wondering what the hell you’re supposed to do with them. I should make it clear that you don’t actually need these files to make this work. The files simply provide a way for us to figure out where the interesting metrics exist within the yang model, so that we can configure the 9800 to send them. We won’t be uploading these files to the server. We will just be referencing them on our workstation.
These files outline the capabilities of the telemetry that is available from the Catalyst 9800 (as well as other Cisco IOS-XE devices). They are essentially our “map” to determine what information we can gather from the controller. Unfortunately, this “map” sucks! Navigating these files can be a real bear. Luckily for you, I will provide you with the information you need to get most of the common statistics, and you’ll only have to navigate these files if you want to see things that I don’t outline here. You can basically skip down to the end, where I list all of the telemetry commands if you don’t want to break any new ground.
Cisco offers a Yang Explorer, which is flash-based and runs in your browser. Unfortunately, it seems pretty terrible and I could not get it to work properly. I gave up on it after 20-30 minutes of screwing around with it.
Edit: @fsedano shared this video that he made, explaining how to use Cisco’s Yang Explorer. With his explanation, I was able to get it to pull Yang models from the 9800, and use it to explore the Yang model tree. This tool does clearly display the xpath filter, and may be easier to navigate than the methods I describe below. It’s your choice which method to use to obtain the location of the metrics.
Edit2: Kjetil Teigen Hansen wrote a blog entry on how to use Netconf Explorer to gather this information. If you struggle with Yang Explorer, you may consider this option as well: https://wirelessisfun.wordpress.com/2020/12/10/network-telemetry-data-and-grafana-part-1-the-advanced-netconf-explorer/
In order to determine what metrics existed, and where they are within the model, I used a tool called “pyang” for MacOS (follow that link to learn how to install it). This tool allows you to open a .yang file, and see the contents in a more concise format.
Let’s start with a small file, just to get the lay of the land. Run the following command to see what is available to us in the “Cisco-IOS-XE-wireless-general-oper.yang” file:
pyang Cisco-IOS-XE-wireless-general-oper.yang -f treeYou should be greeted with a tree of information that looks like this:
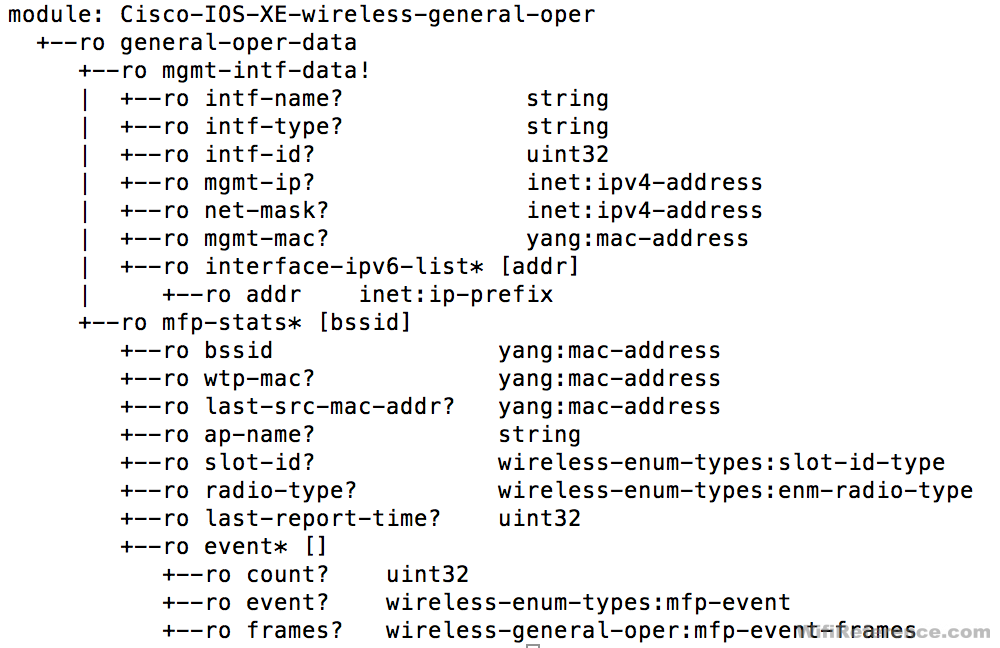
This is the “general” Yang model for the Catalyst 9800 controller. Subscribing to it would give you information such as the management IP address, MAC address, and other basic information. None of this is very useful, and certainly not something we want to chart/graph. However, it is one of the smallest Yang models available for the 9800, and I wanted to start with something easy to digest.
This is a good opportunity to talk about the hierarchy/path. When configuring the 9800 “subscriptions,” you must specify the path for each group of metrics you want to subscribe to. In the above example, if we wanted to obtain the Management IPv4 address, we would need to subscribe to the following tree: /wireless-general-oper:general-oper-data/mgmt-intf-data, and then reference the “mgmt-ip” key. I’ll try to break this down a bit better:
Let’s break it down into sections:
[/wireless-general-oper] : [general-oper-data] / [mgmt-intf-data]
“/wireless-general-oper” comes from the filename itself. This is the main category for the information.
“general-oper-data” is the top level of the tree.
“mgmt-intf-data” is the level of the next level down in the tree, and also the portion of the tree that contains the key we are interested in.
The need for this specific path will become evident in the next section, when we are actually configuring the telemetry subscriptions in the Catalyst 9800.
Feel free to explore these files and look at all of the data that is available. Just about every statistic or piece of information that is available in the WLC GUI is available in the telemetry model somewhere.
As you find information that you’re interested in, make sure to record the path, as well as the key (and description, if available). We’ll use this information in the 9800 configuration.
A couple particular files definitely worth checking out are the Cisco-IOS-XE-wireless-access-point-oper.yang and Cisco-IOS-XE-wireless-client-oper.yang files. Most of the data we will be working with is obtained from those two portions of the yang model.
Setting up the telemetry subscriptions in the Catalyst 9800
Now that you have found the metrics you want to visualize, we need to configure the Catalyst 9800 to stream the data to Telegraf. This is done by creating “telemetry subscriptions” in the 9800. These subscriptions define the information you want, the format you want it in, where you want to send it, and how often you want to send it there. Here is an example of one telemetry subscription (we will have many, by the time we are done with this):
telemetry ietf subscription 21
 encoding encode-kvgpb
 filter xpath /wireless-client-oper:client-oper-data/traffic-stats
 source-address 10.0.0.207
 stream yang-push
 update-policy periodic 1000
 receiver ip address 10.0.0.87 57000 protocol grpc-tcp
I’ll break this down line-by-line:
telemetry ietf subscription 21This creates a telemetry subscription. The number at the end of the line is an identifier. It is an arbitrary number, but must not overlap with any existing telemetry subscriptions. Since DNAC uses subcription numbers starting with 1000+, I figured it was safe to start with lower numbers. You can reference this number with show commands, to determine if the subscription configuration is valid and active.
encoding encode-kvgpbThis signifies that we will be using kvGBP encoding. I have no idea what that means, and it isn’t really important. Just know that there are two options and you want to use kvgbp.
filter xpath /wireless-client-oper:client-oper-data/traffic-statsThis is the line that references the path to the container of information that you are interested in. It always begins with “filter xpath” and then is followed with the specific path in the yang model (which can be obtained with pyang, as described above). The purpose of this line is to define that you only want information from this part of the yang model to be exported to the subscriber. If you didn’t have a filter, it may send all metrics from all categories to the receiver, which would be an overwhelming amount of data.
source-address 10.0.0.207This is the address that the WLC will use to send the information. This will usually be the IP address of the management interface of the WLC, and you will need to change it to match your WLC.
stream yang-pushWe want this to be a yang-push stream
update-policy periodic 1000This defines how often you want to send data to the subscriber (in milliseconds). Once per second has worked well in my testing. Another option is “on-change,” which will send the data each time it is changed. I don’t need my graphs to update more frequently than once per second, so I defined it as “1000.”
receiver ip address 10.0.0.87 57000 protocol grpc-tcpThe last line sets the address that you want to stream the data to; the receiver/subscriber. This will be the IP address of the Linux server that you setup. Make sure you match the port to the port you defined in the telegraf.conf file above (for the cisco_telemetry_mdt plugin listener).
My telemetry configuration
Here is the configuration for all of the telemetry subscriptions I setup. This will get you all of the data that you see referenced in this article, as well as a whole lot more. I’m only graphing a fraction of the metrics that these subscriptions are providing. You can modify the IP addresses to suit your needs, and paste this directly into your controller (assuming you don’t have any existing telemetry configuration that overlaps with these IDs).
telemetry ietf subscription 21
 encoding encode-kvgpb
 filter xpath /wireless-client-oper:client-oper-data/traffic-stats
 source-address 10.0.0.207
 stream yang-push
 update-policy periodic 1000
 receiver ip address 10.0.0.87 57000 protocol grpc-tcp
telemetry ietf subscription 22
 encoding encode-kvgpb
 filter xpath /wireless-client-oper:client-oper-data/dc-info
 source-address 10.0.0.207
 stream yang-push
 update-policy periodic 1000
 receiver ip address 10.0.0.87 57000 protocol grpc-tcp
telemetry ietf subscription 23
 encoding encode-kvgpb
 filter xpath /wireless-client-oper:client-oper-data/sisf-db-mac
 source-address 10.0.0.207
 stream yang-push
 update-policy periodic 1000
 receiver ip address 10.0.0.87 57000 protocol grpc-tcp
telemetry ietf subscription 24
 encoding encode-kvgpb
 filter xpath /wireless-client-oper:client-oper-data/client-wsa-info
 source-address 10.0.0.207
 stream yang-push
 update-policy periodic 1000
 receiver ip address 10.0.0.87 57000 protocol grpc-tcp
telemetry ietf subscription 25
 encoding encode-kvgpb
 filter xpath /wireless-access-point-oper:access-point-oper-data/radio-oper-stats
 source-address 10.0.0.207
 stream yang-push
 update-policy periodic 1000
 receiver ip address 10.0.0.87 57000 protocol grpc-tcp
telemetry ietf subscription 26
 encoding encode-kvgpb
 filter xpath /wireless-access-point-oper:access-point-oper-data/ap-name-mac-map
 source-address 10.0.0.207
 stream yang-push
 update-policy periodic 1000
 receiver ip address 10.0.0.87 57000 protocol grpc-tcp
telemetry ietf subscription 27
 encoding encode-kvgpb
 filter xpath /wireless-access-point-oper:access-point-oper-data/capwap-data
 source-address 10.0.0.207
 stream yang-push
 update-policy periodic 1000
 receiver ip address 10.0.0.87 57000 protocol grpc-tcp
telemetry ietf subscription 28
 encoding encode-kvgpb
 filter xpath /wireless-access-point-oper:access-point-oper-data/radio-oper-data
 source-address 10.0.0.207
 stream yang-push
 update-policy periodic 1000
 receiver ip address 10.0.0.87 57000 protocol grpc-tcp
telemetry ietf subscription 29
 encoding encode-kvgpb
 filter xpath /wireless-access-point-oper:access-point-oper-data/ssid-counters
 source-address 10.0.0.207
 stream yang-push
 update-policy periodic 1000
 receiver ip address 10.0.0.87 57000 protocol grpc-tcp
telemetry ietf subscription 30
 encoding encode-kvgpb
 filter xpath /wireless-client-oper:client-oper-data/common-oper-data
 source-address 10.0.0.207
 stream yang-push
 update-policy periodic 1000
 receiver ip address 10.0.0.87 57000 protocol grpc-tcp
telemetry ietf subscription 31
 encoding encode-kvgpb
 filter xpath /wireless-rrm-oper:rrm-oper-data/rrm-measurement
 source-address 10.0.0.207
 stream yang-push
 update-policy periodic 1000
 receiver ip address 10.0.0.87 57000 protocol grpc-tcp
telemetry ietf subscription 32
 encoding encode-kvgpb
 filter xpath /wireless-mobility-oper:mobility-oper-data/mobility-node-data
 source-address 10.0.0.207
 stream yang-push
 update-policy periodic 1000
 receiver ip address 10.0.0.87 57000 protocol grpc-tcp
telemetry ietf subscription 33
 encoding encode-kvgpb
 filter xpath /wireless-mobility-oper:mobility-oper-data/wlan-client-limit
 source-address 10.0.0.207
 stream yang-push
 update-policy periodic 1000
 receiver ip address 10.0.0.87 57000 protocol grpc-tcp
You must also enable netconf on the controller for this to work:
netconf ssh
netconf-yang
Once you paste this configuration into the controller, you will want to see if the stream is active, and if the subscriptions are valid. You can do that with the following commands:
show telemetry internal connection
You want to ensure the State is Active
show telemetry ietf subscription [id]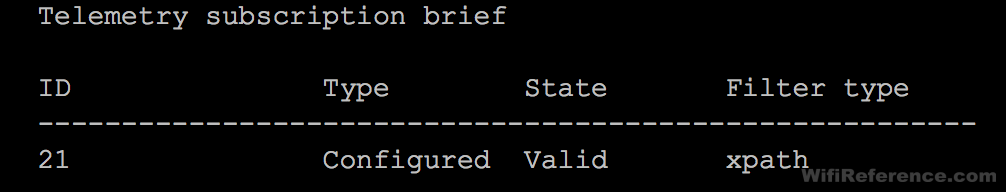
Ensure the State is Valid. If it shows Invalid, the xpath filter line in your subscription configuration is not valid. Expect this to happen multiple times throughout the process. If your telemetry subscriptions came back as Active and Valid, you can proceed to creating the graphs in Grafana.
Adding the charts to Grafana
It’s important to understand that at this point, Telegraf is receiving the streams of data from the controller, even if you haven’t setup any graphs yet. The data is continuously being updated and stored in InfluxDB, regardless of whether or not you use it. This allows you to experiment with all different types of charts with real data. The longer you wait to configure the charts, the more historical data the system will be able to show you.
Let’s create a new Dashboard and call it Access Points. This dashboard will include Access Point-related statistics. Of course, you can call these dashboards anything you want, and organize them any way you want.
Click the New dashboard button:
Now is where things get more complicated; especially if you aren’t used to working with database queries. I’m definitely not an expert in this area, but I’ve managed to make it work well enough for my purposes. Hopefully I can explain it well enough to get your environment working as well.
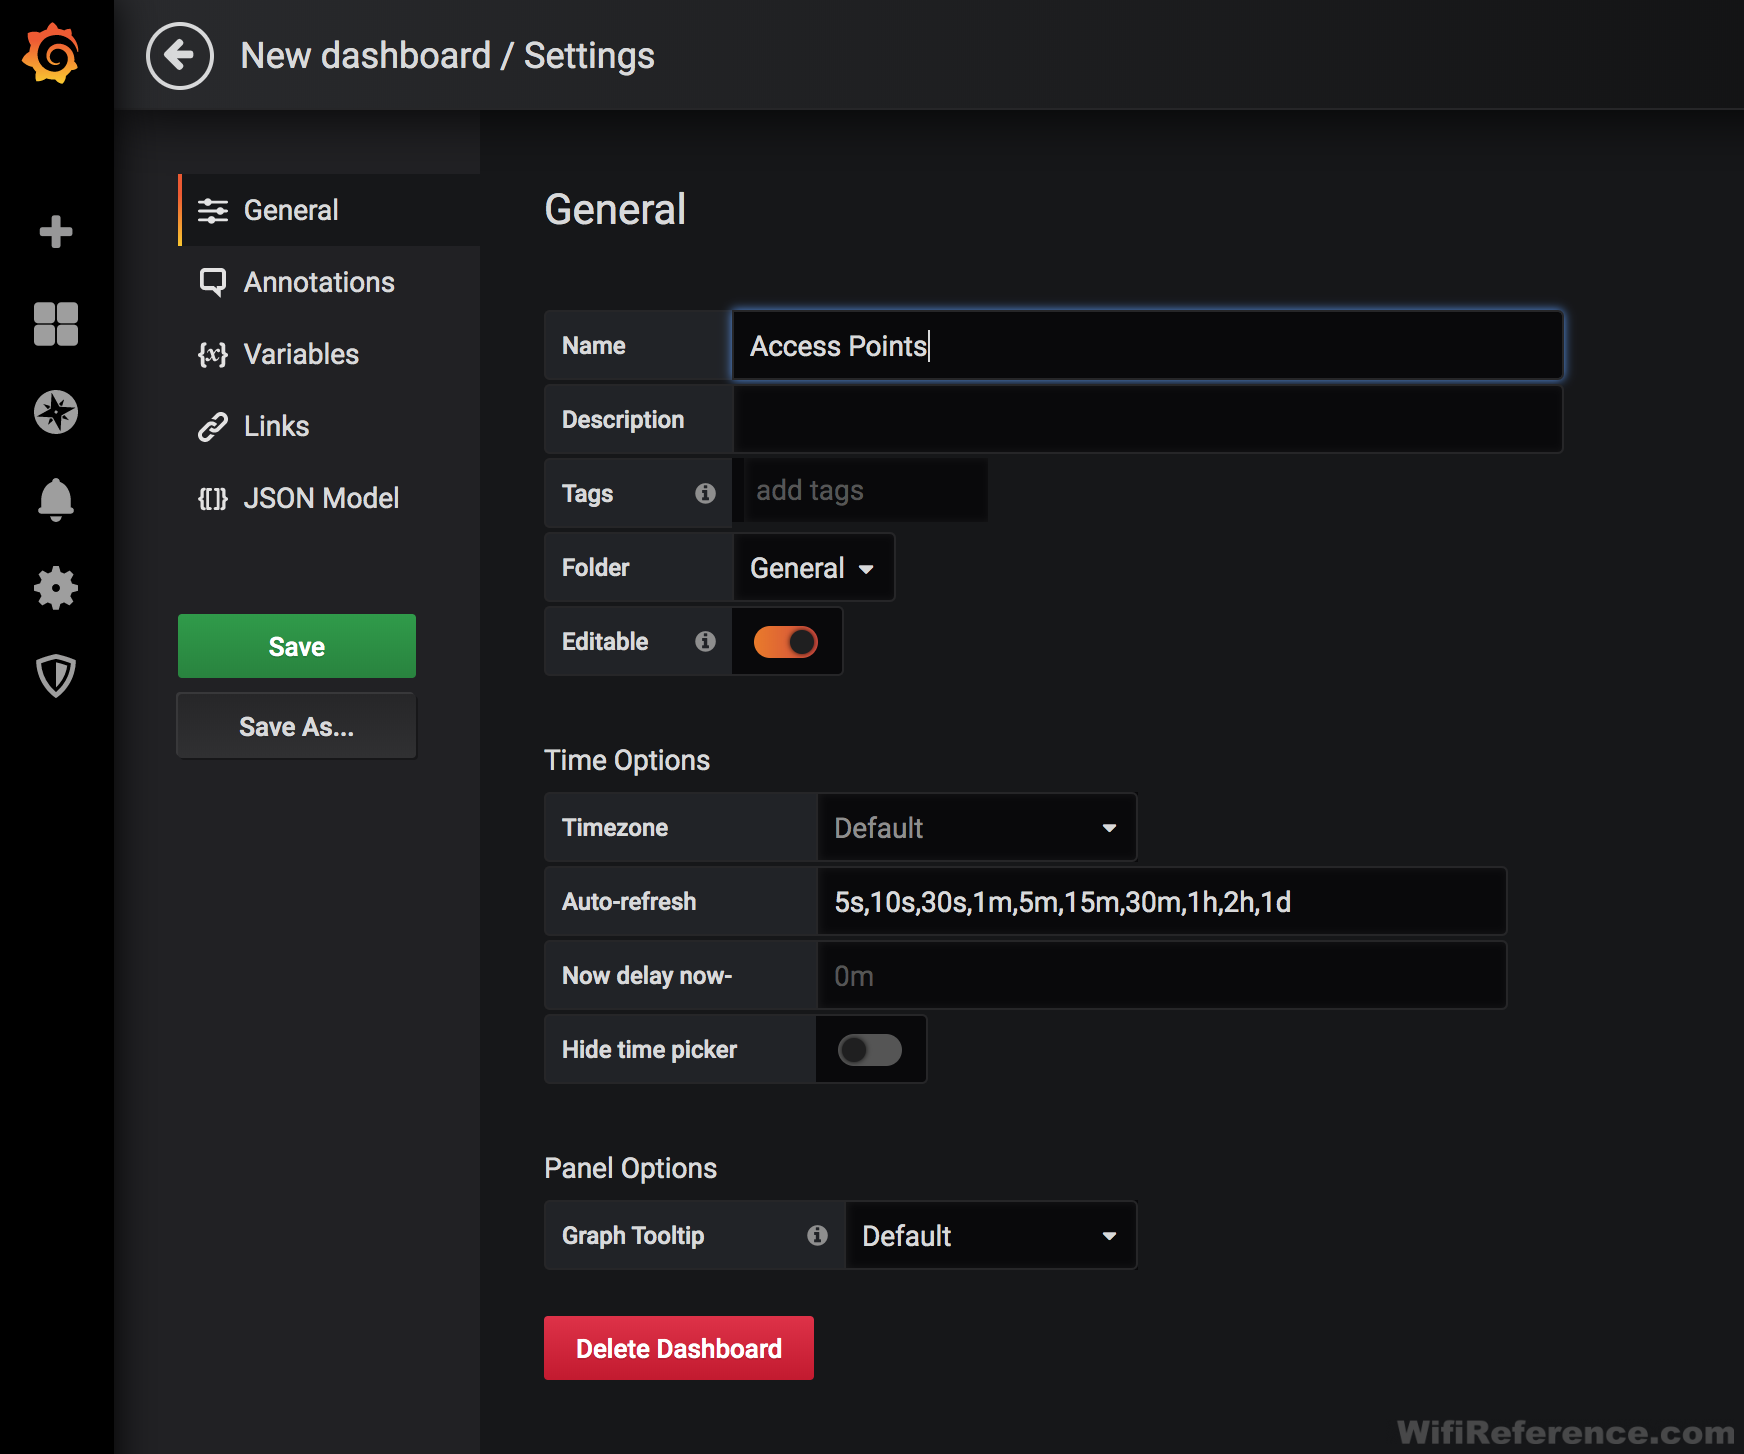
Click the gear in the upper-right corner of the screen to name the Dashboard:
Name the Dashboard and click Save
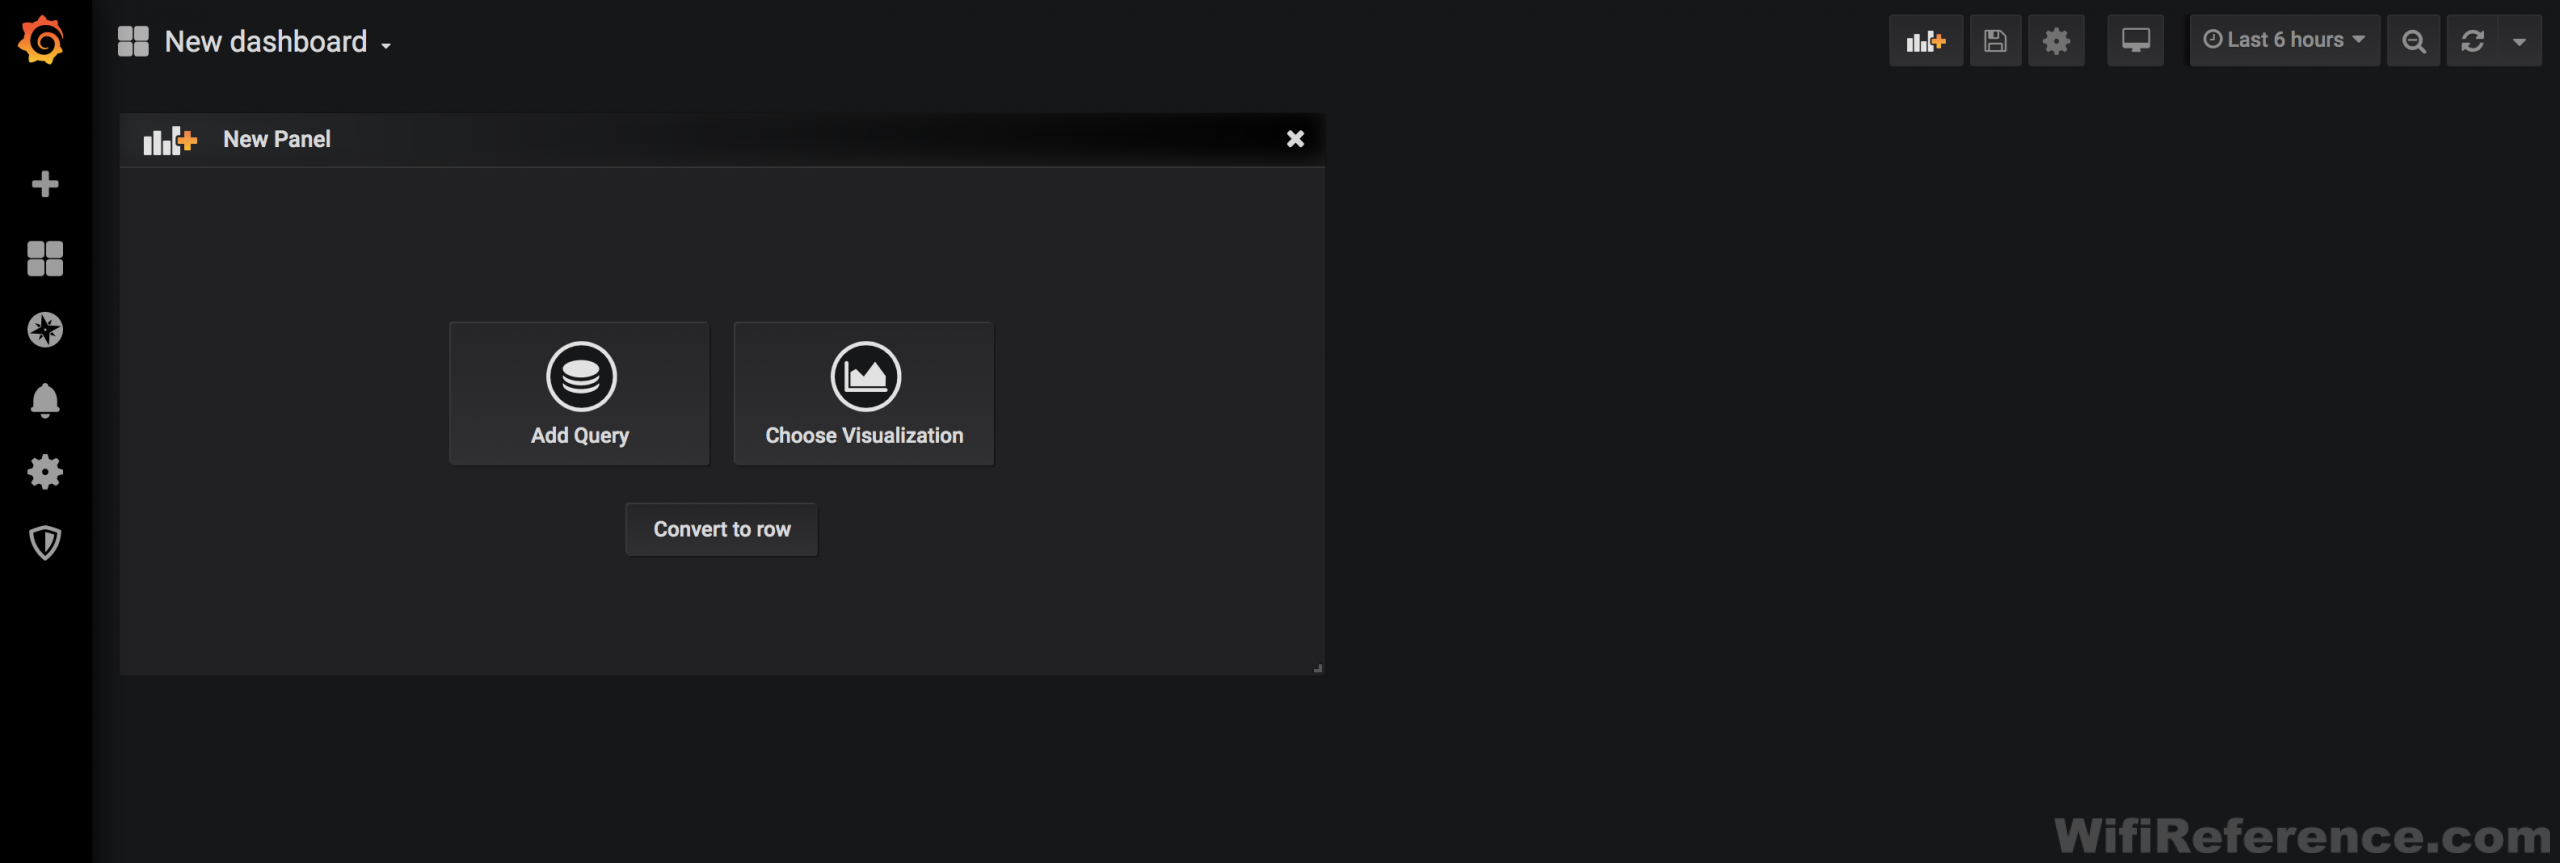
Once your new dashboard is created, you will be presented with a blank screen. Click the small icon that looks like a chart with a + symbol in the upper-right corner, to create a new Panel.
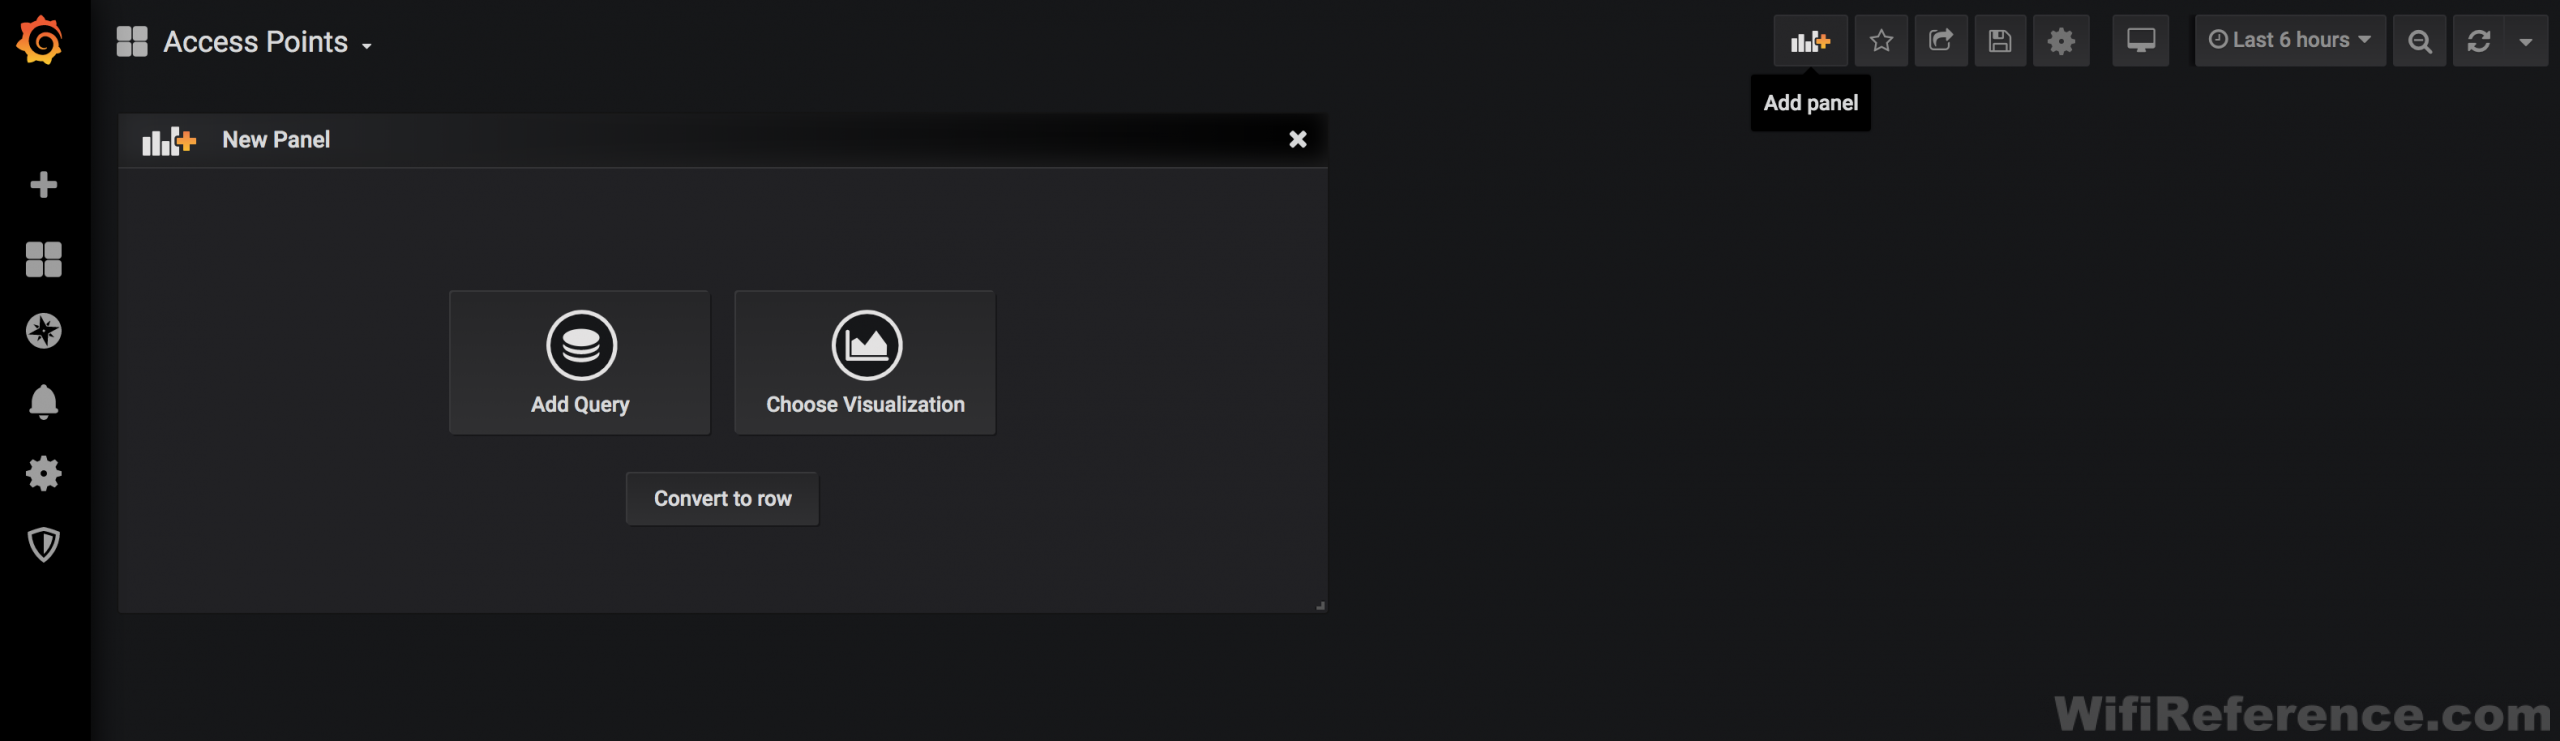
Click the “Add Query” button
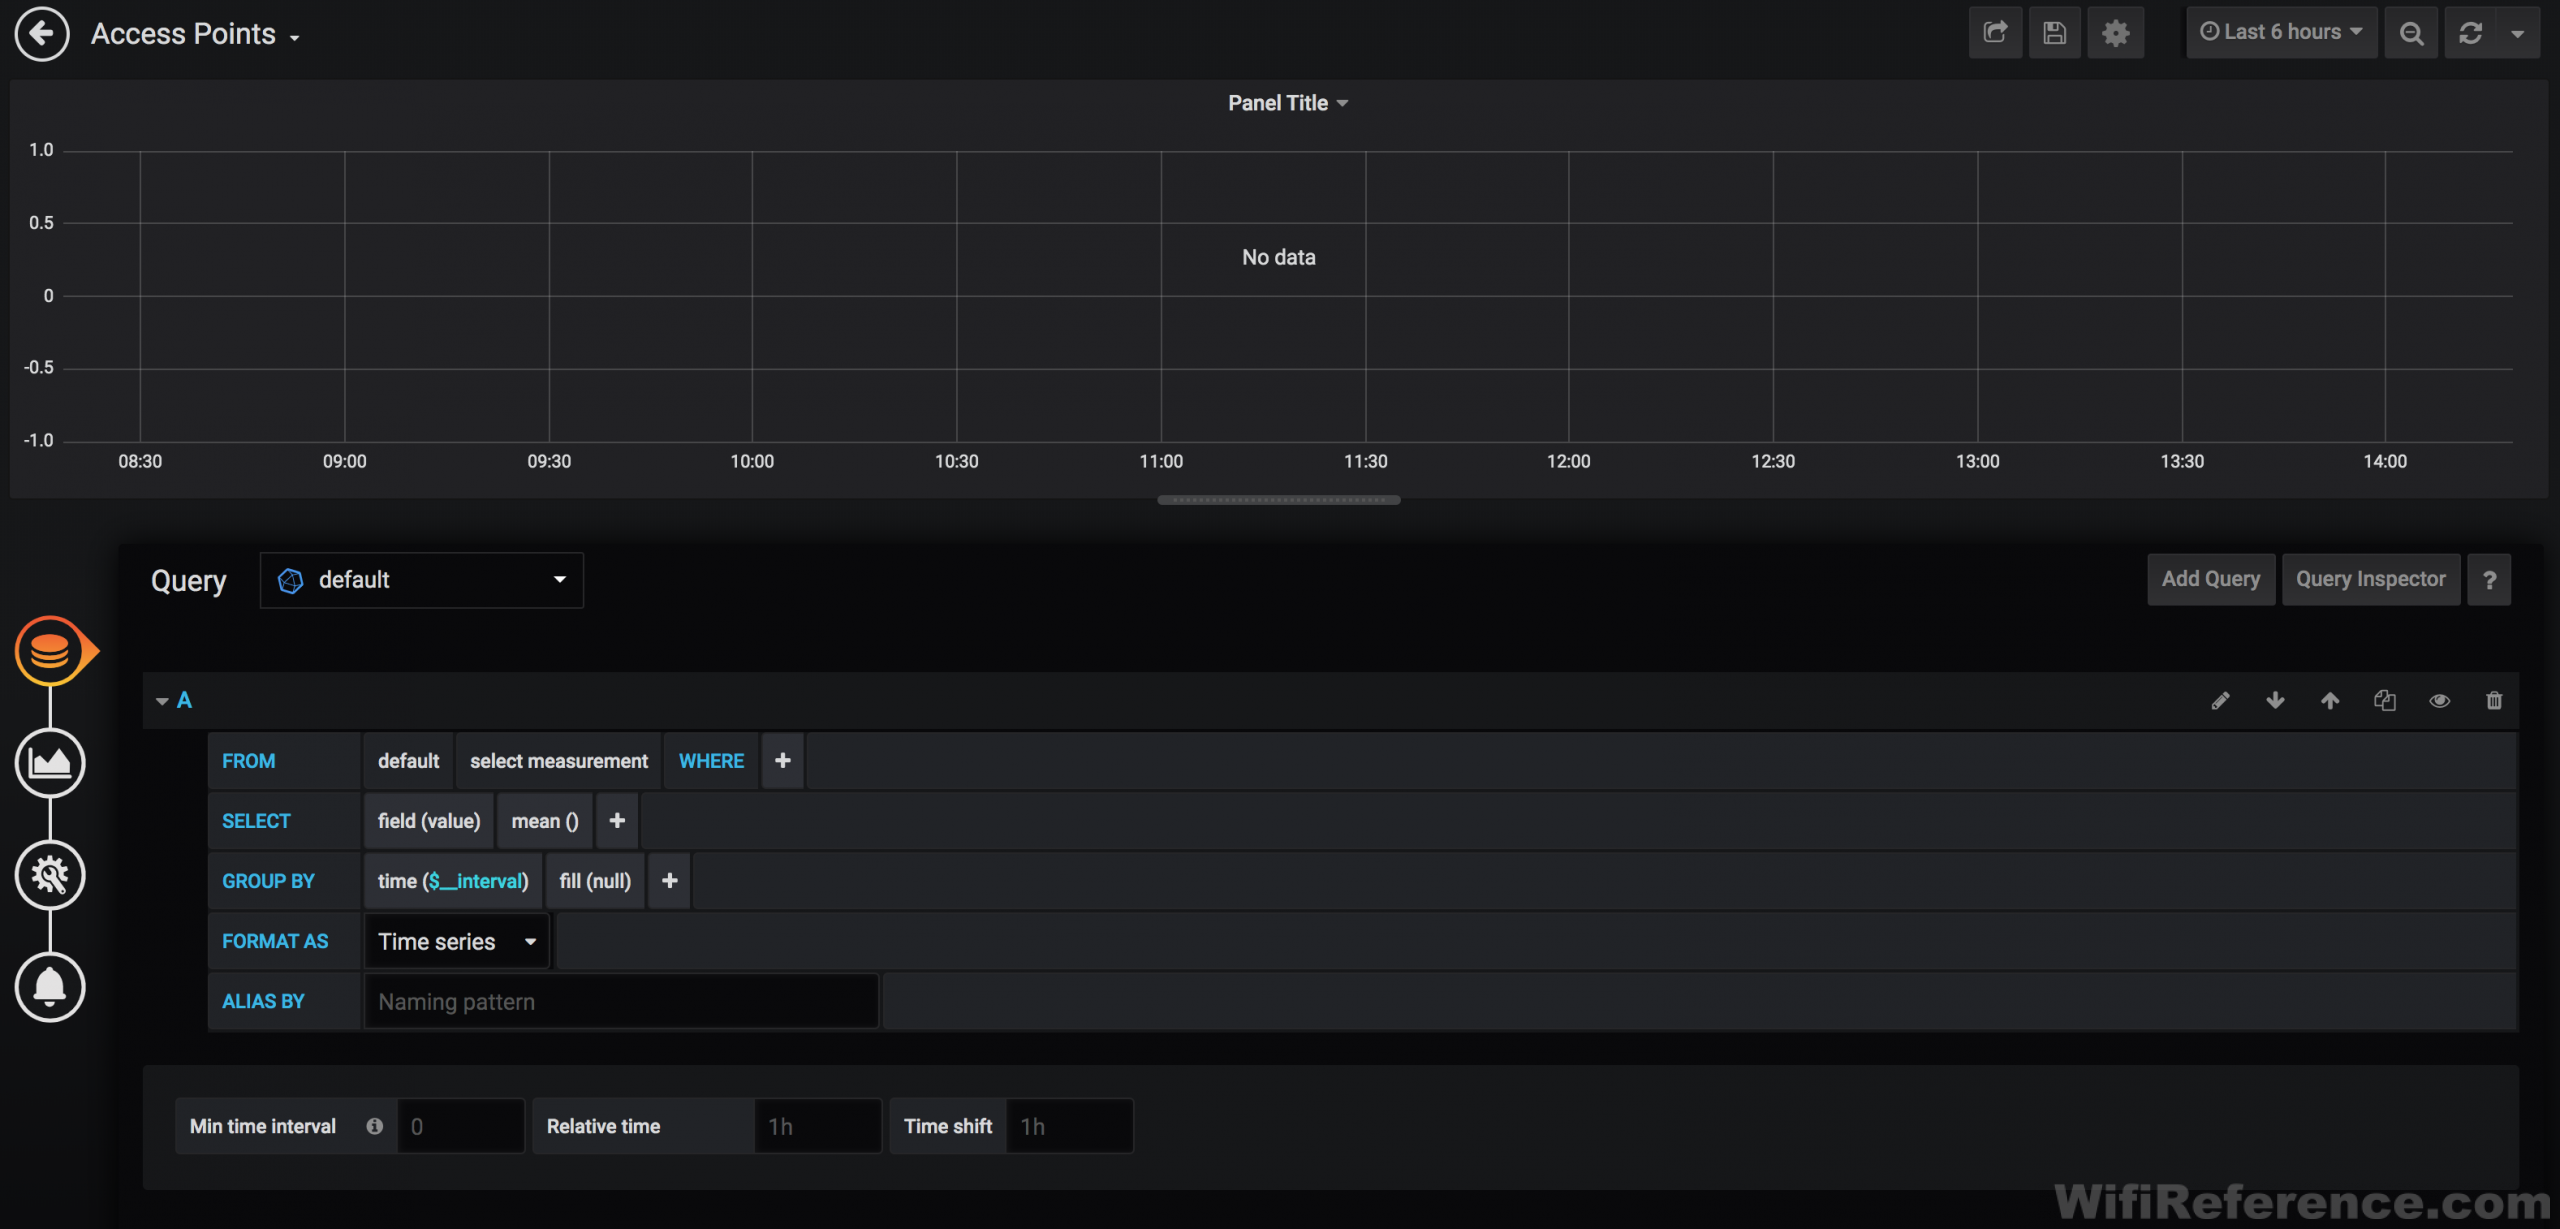
Get familiar with this screen, because you’re going to be spending a lot of time looking at this query editor. This is where you select which metrics you want to include on the chart. Let’s start with something simple like client count per SSID.
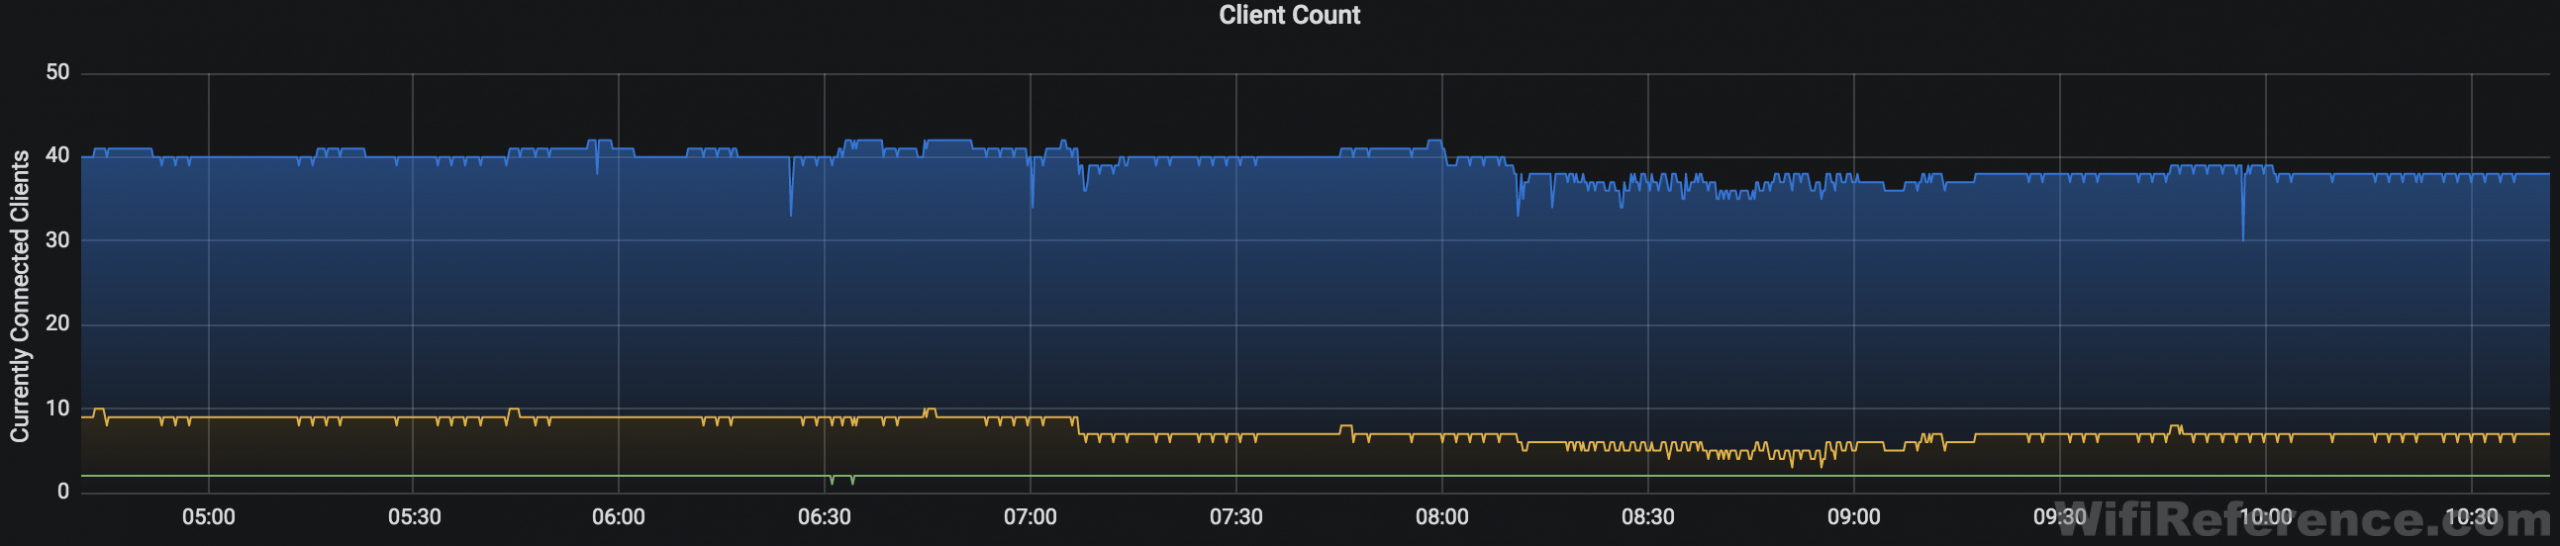
Graphing Client Count
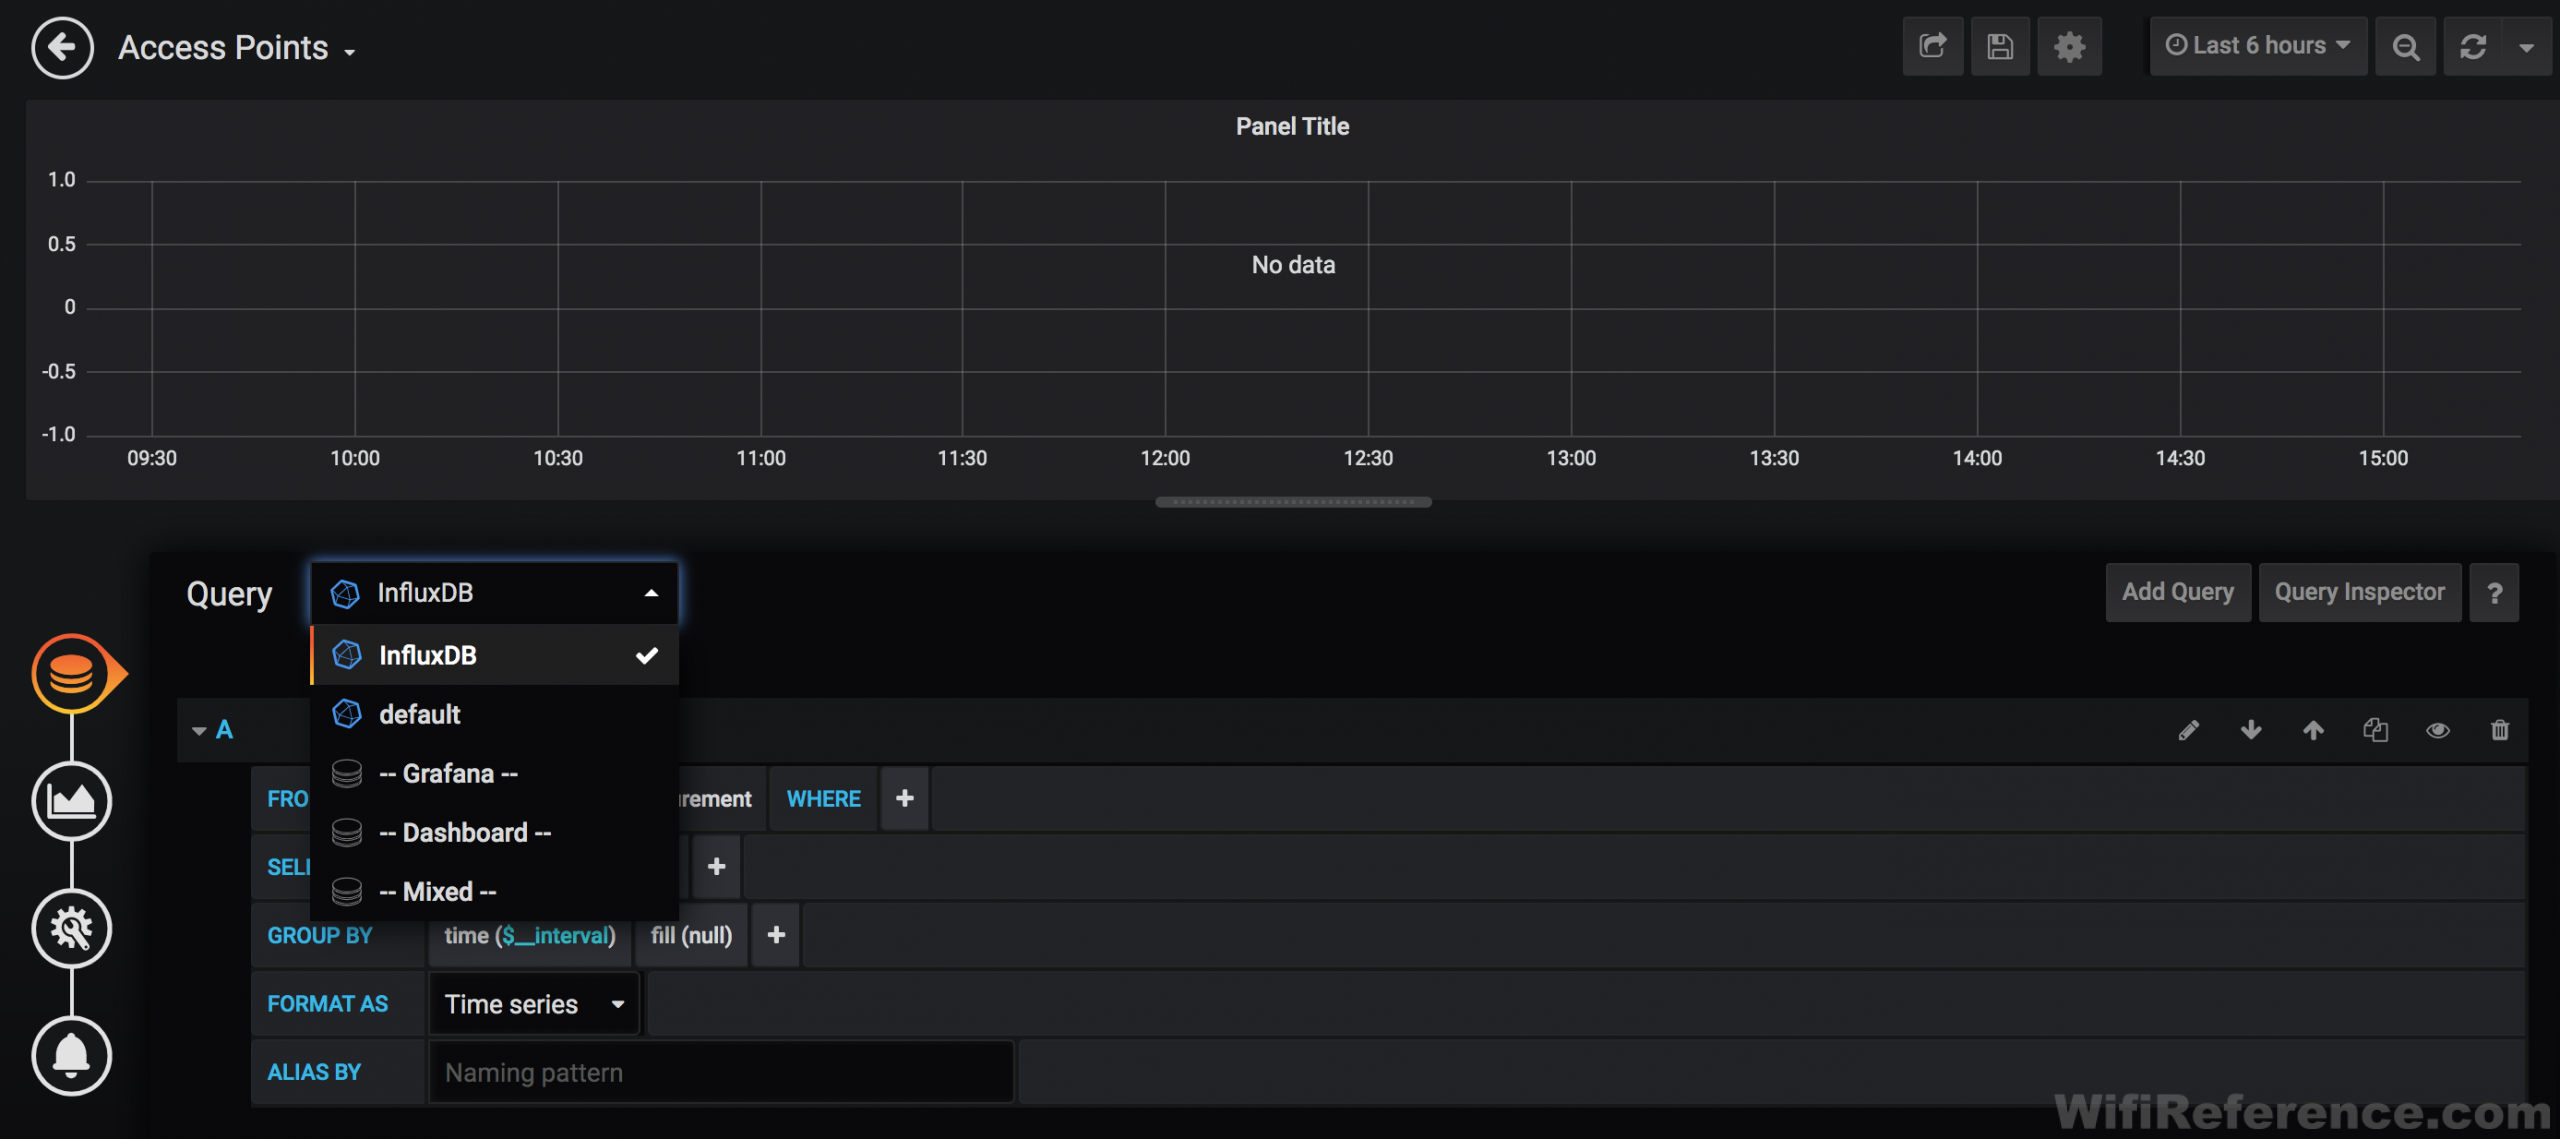
Select InfluxDB in the Query drop-down box
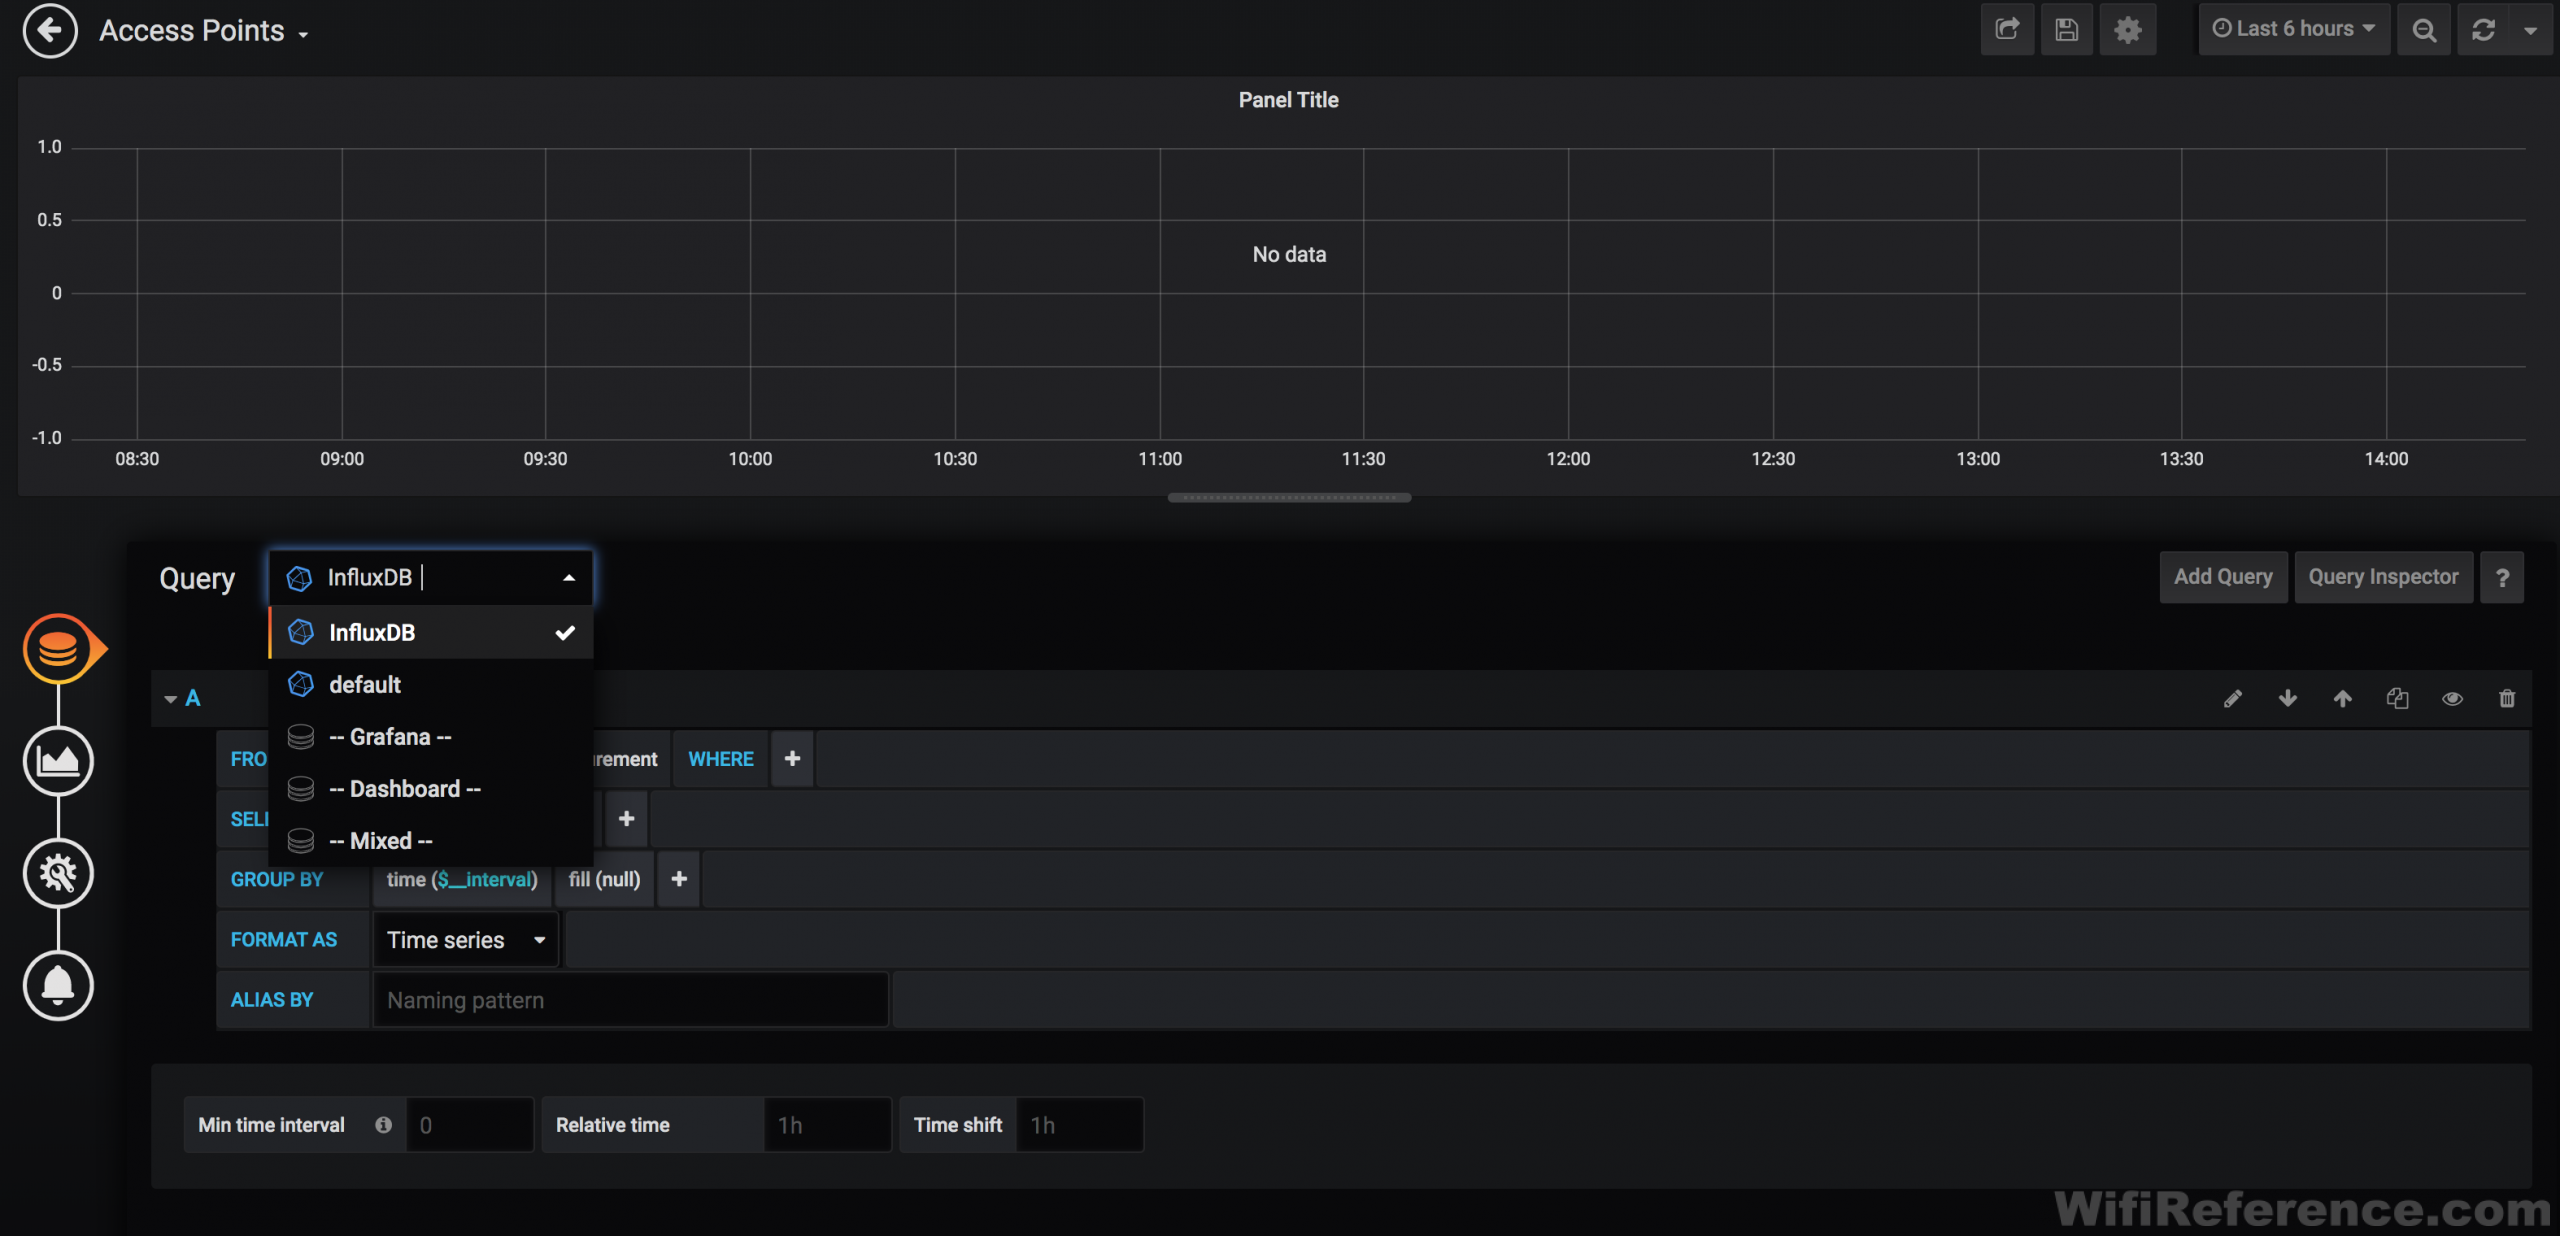
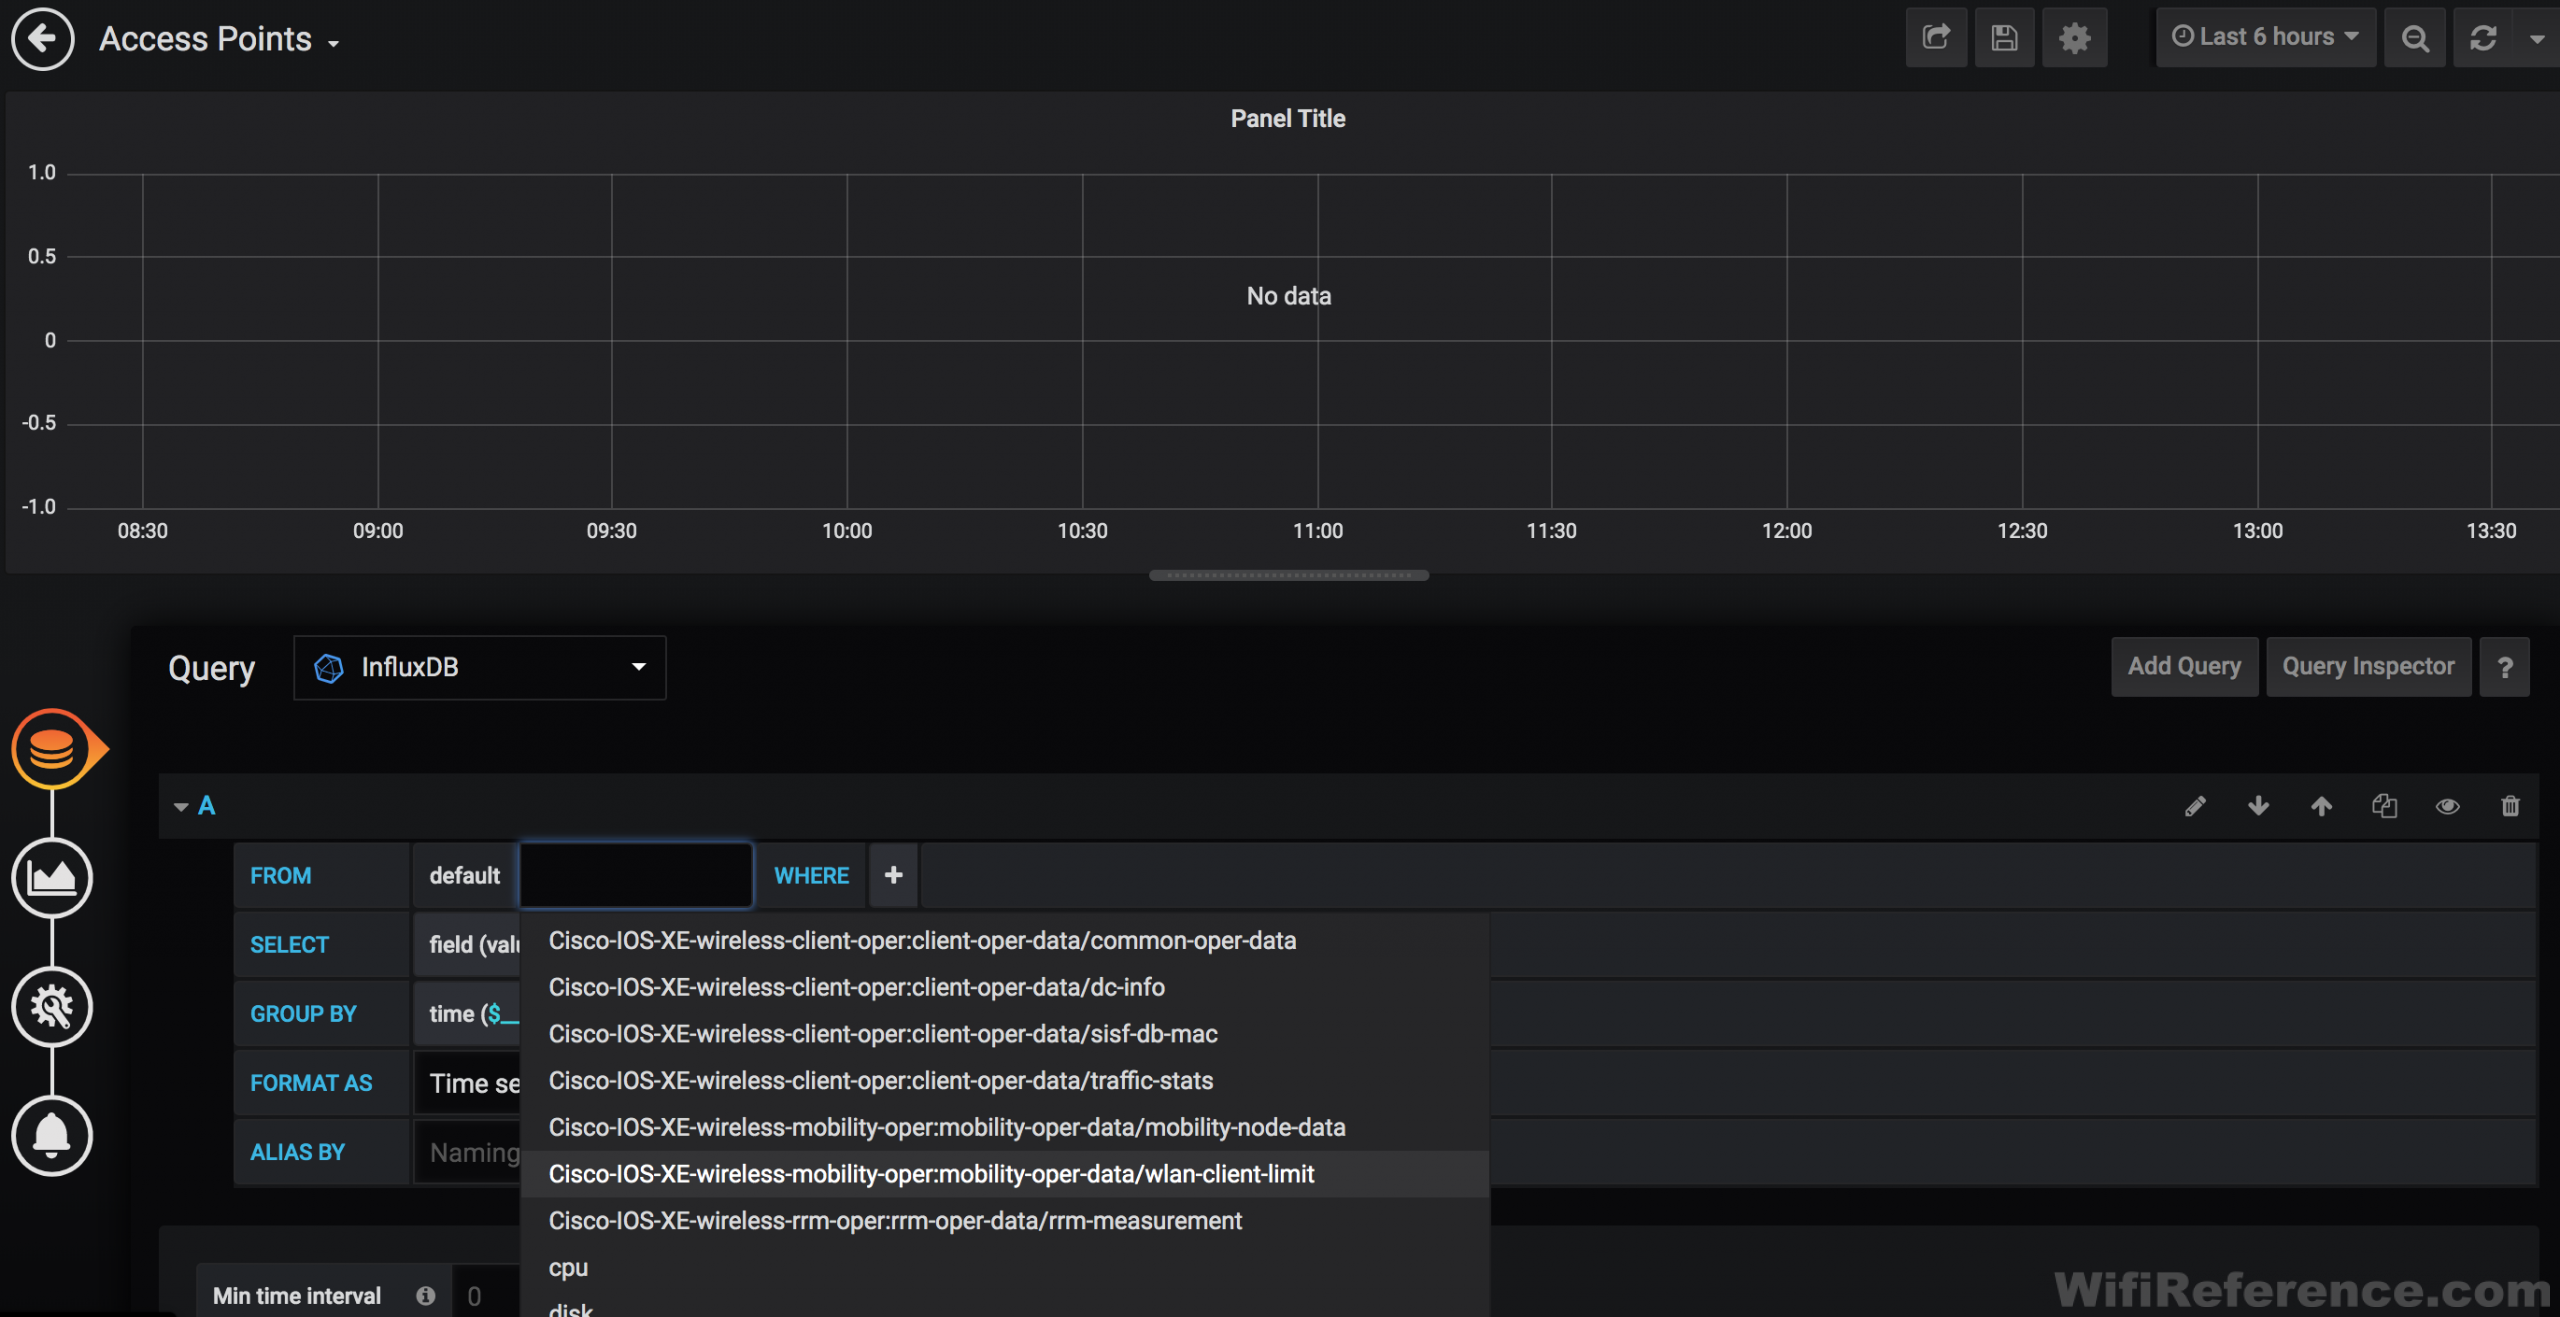
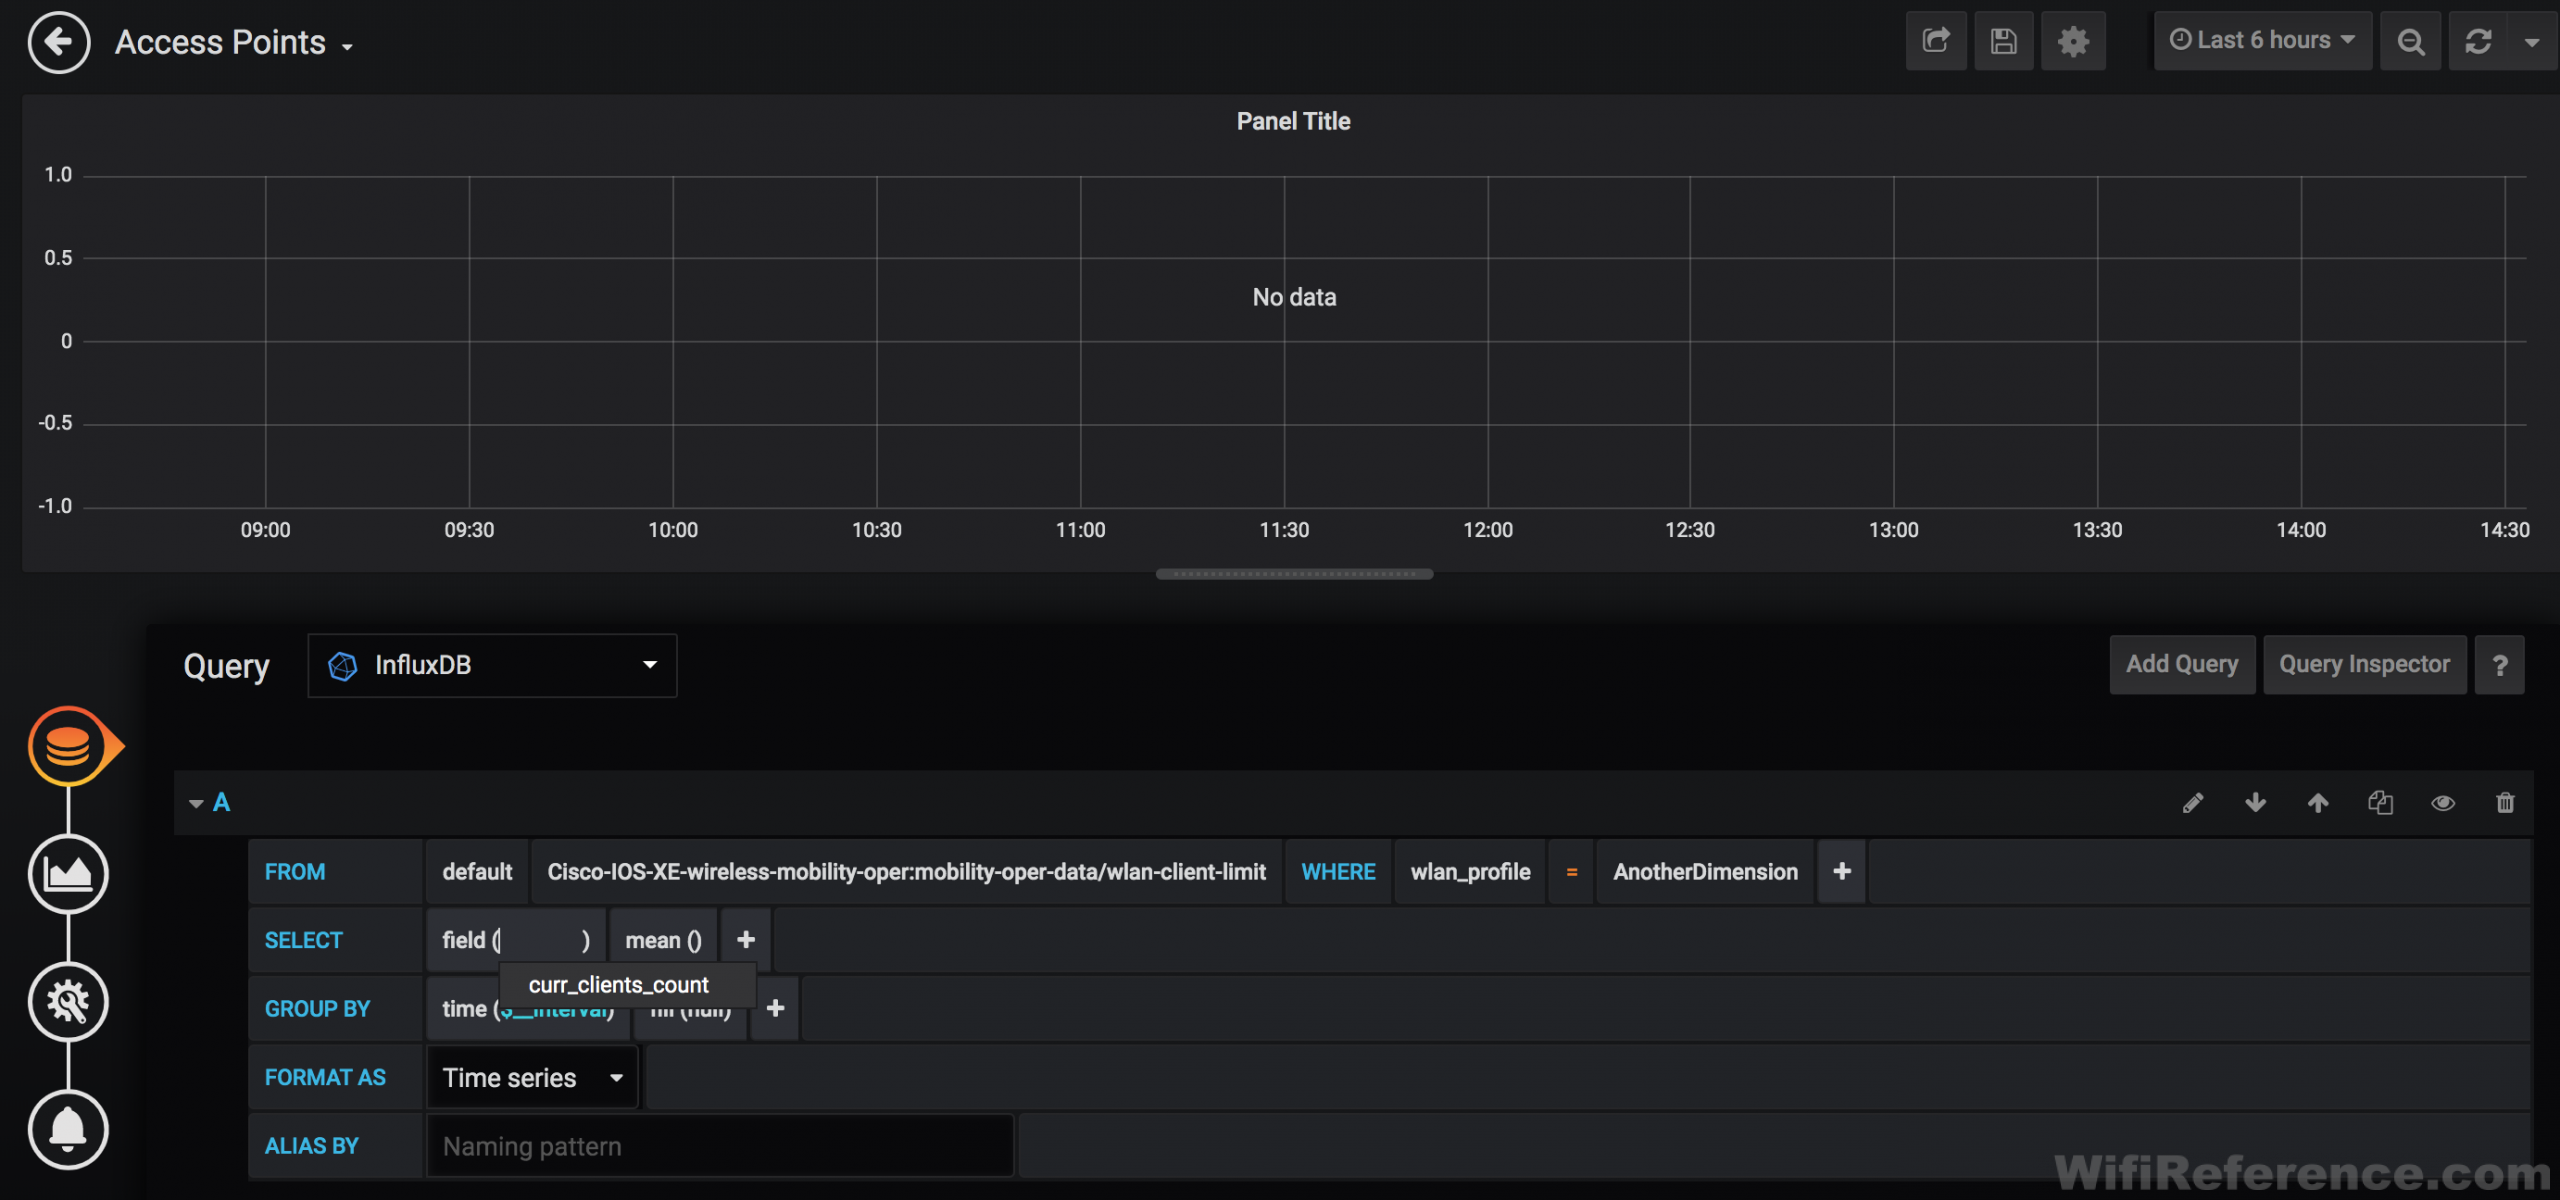
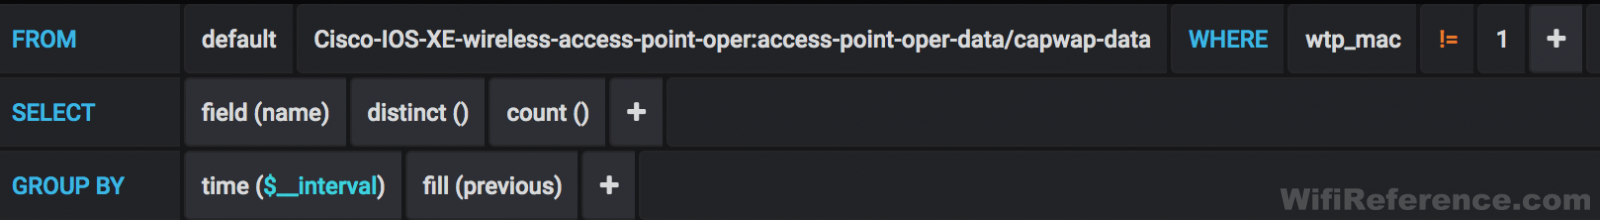
Now click the “select measurement” box within the “A” query:
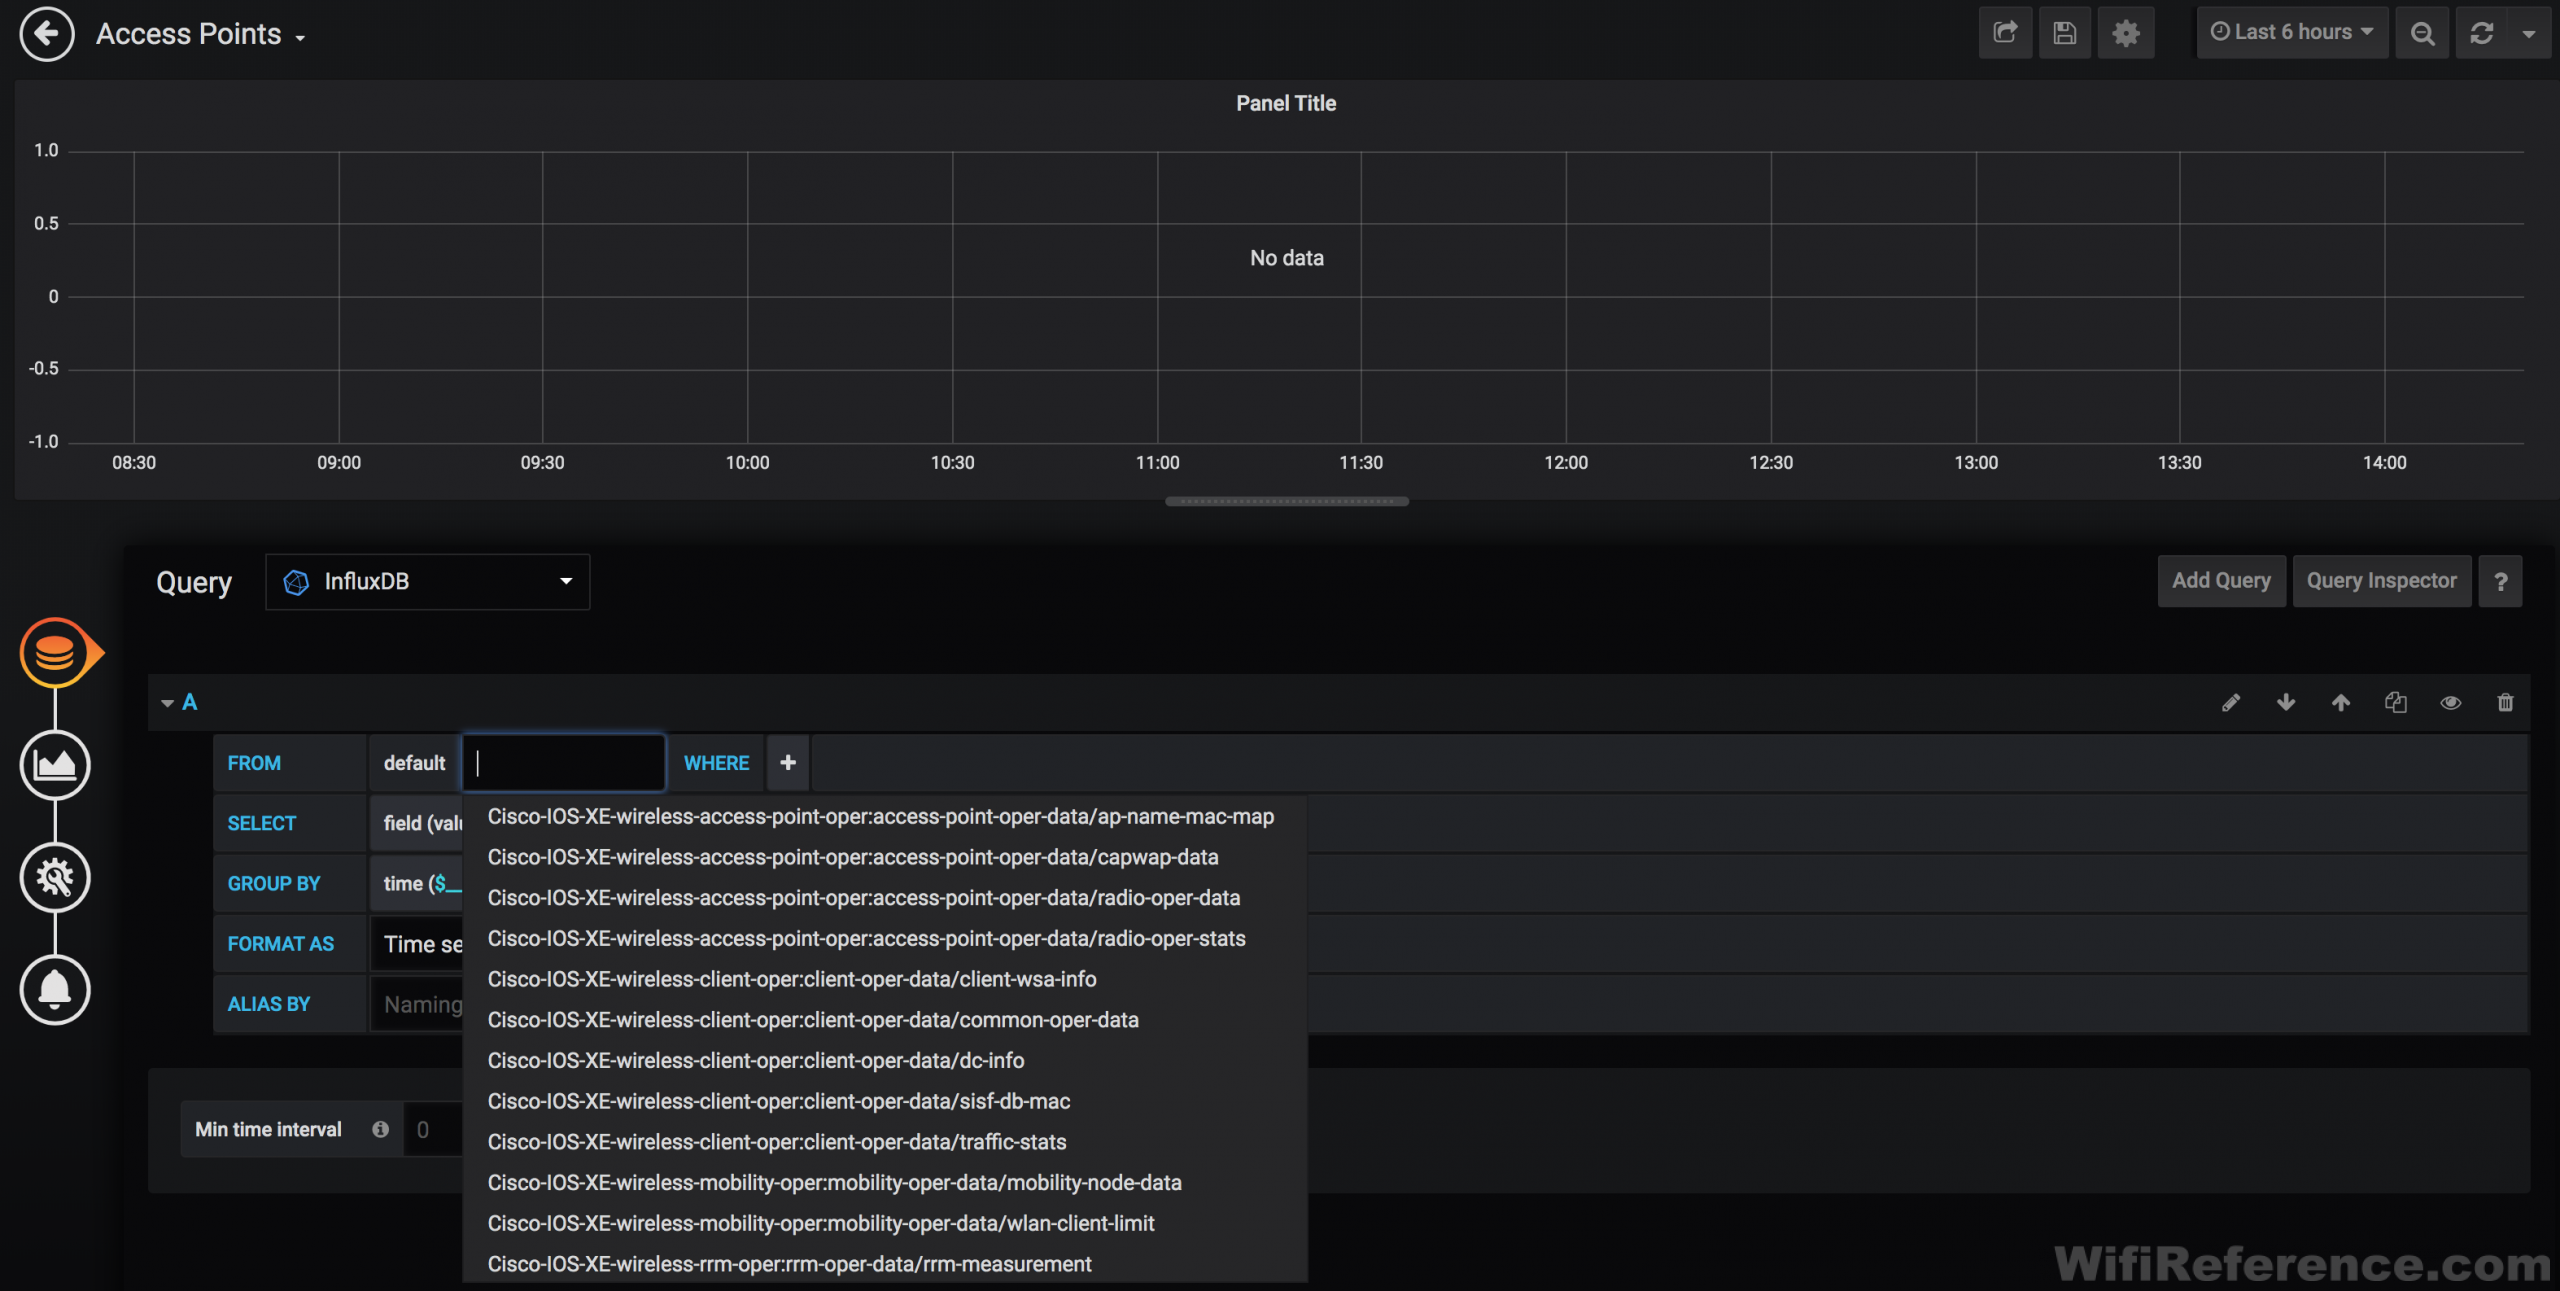
Look familiar? These are the yang model paths that we specified in the xpath filter of each of the subscription configurations in the 9800. This is where the notes you took down earlier come in handy. You know, the notes of all the metrics you found while exploring the yang model trees? You did explore the yang models and take notes, right?
Currently connected clients, per SSID can be found in the “Cisco-IOS-XE-wireless-mobility-oper:mobility-oper-data/wlan-client-limit” path, so select that path:
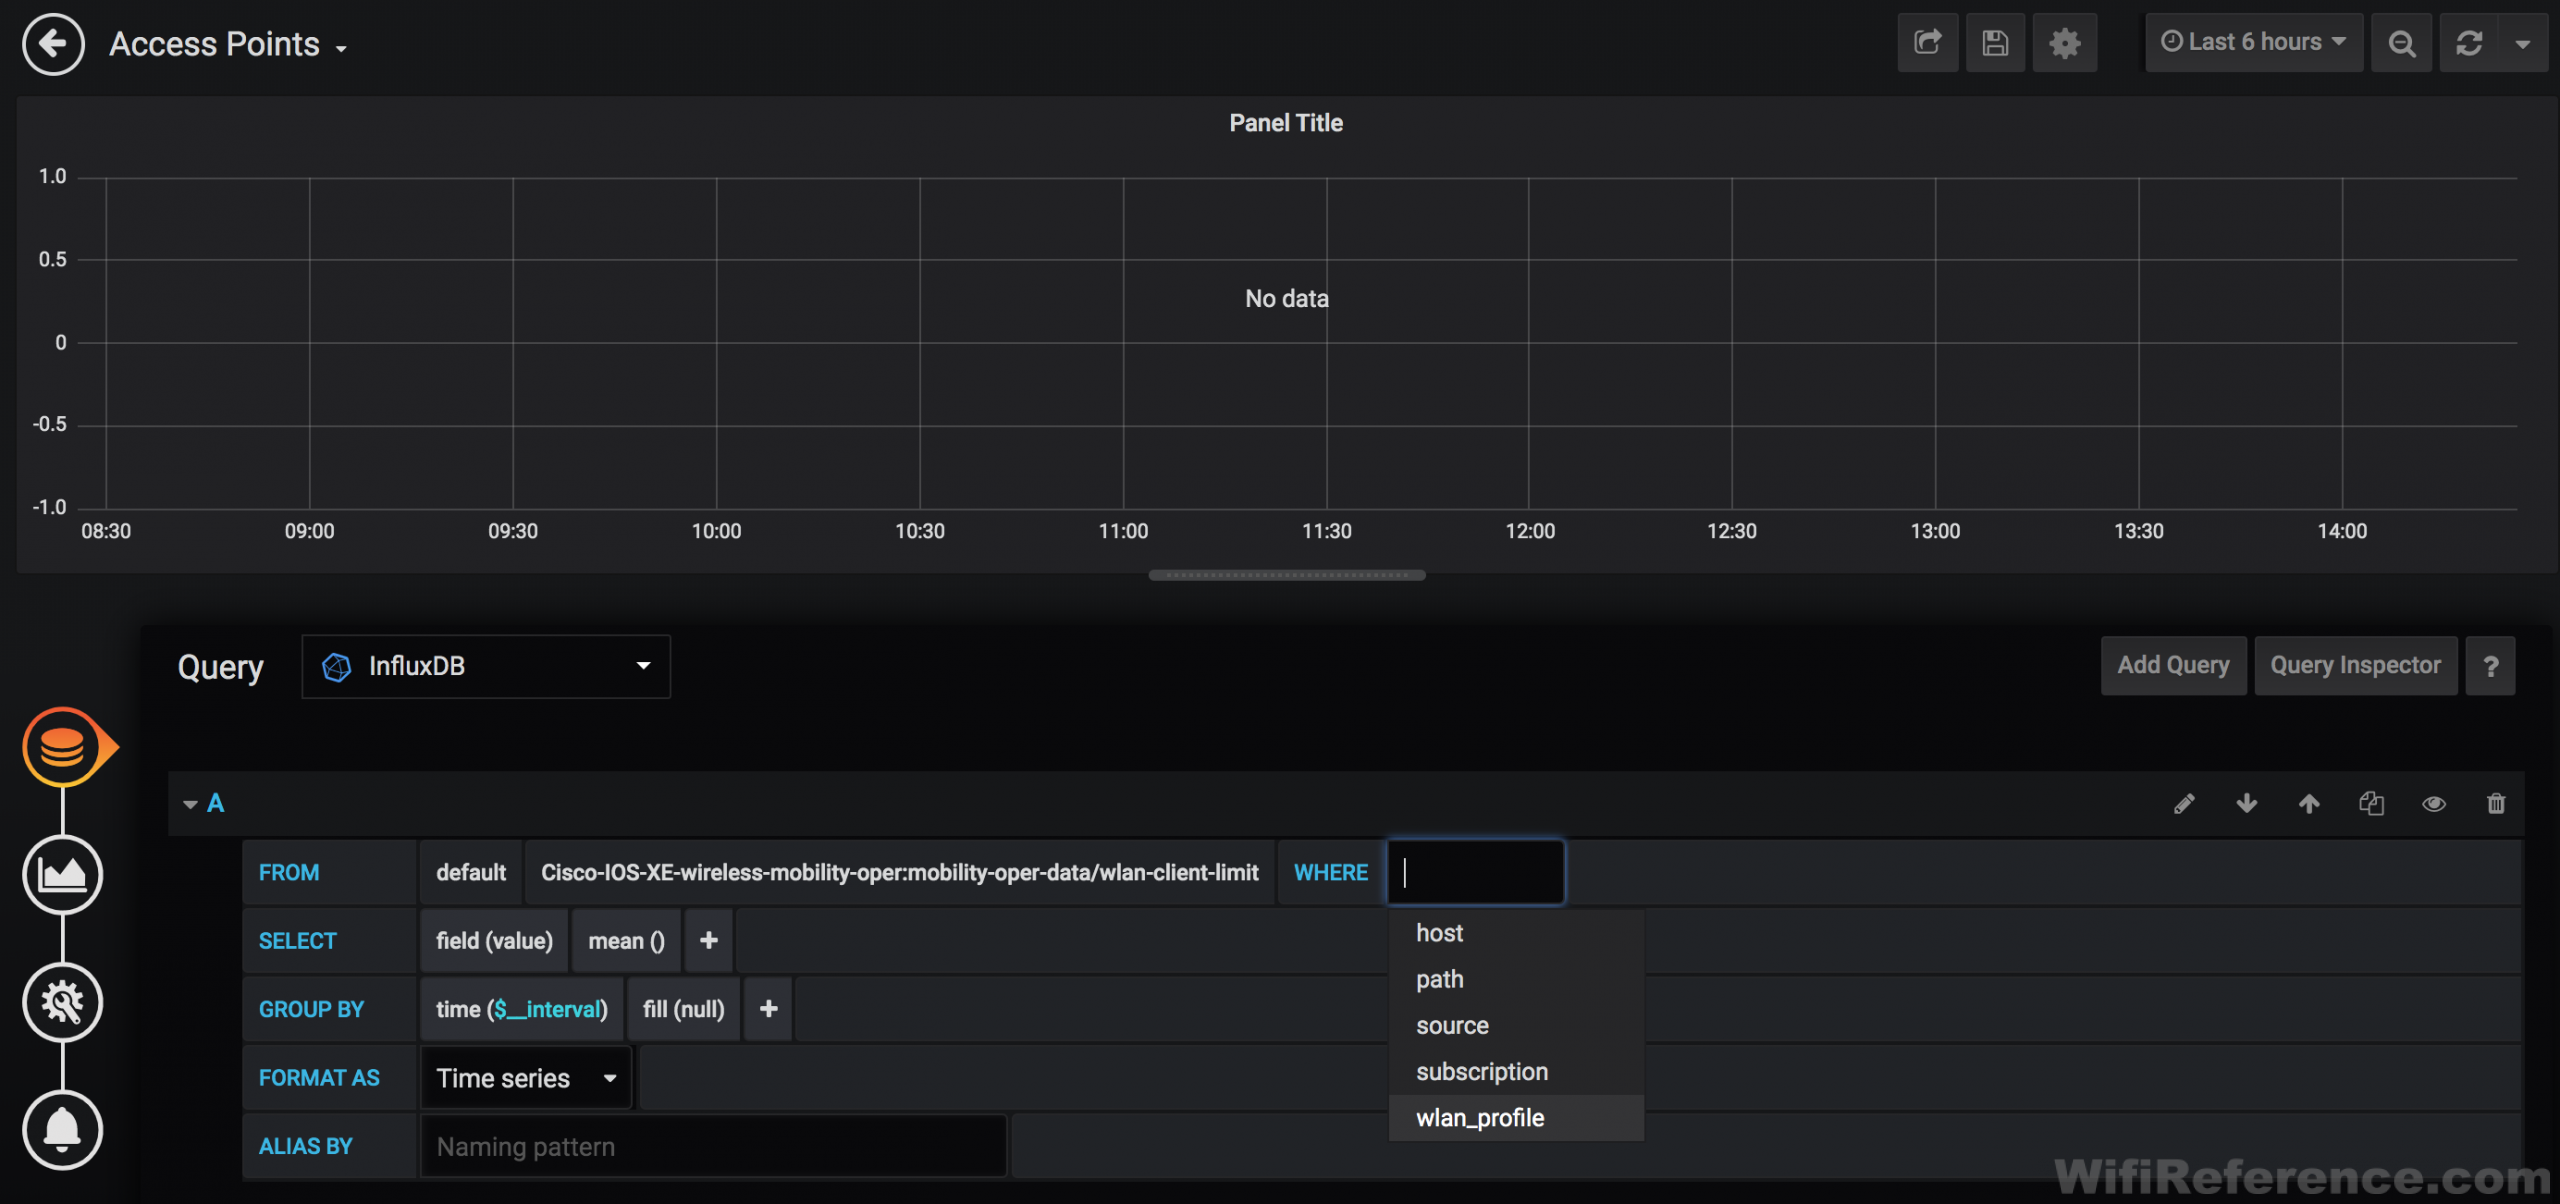
Since this is per-SSID, we need to also define each SSID for which we want to track connected clients. To do this, we will add a WHERE “wlan_profile” clause to the query:
Lastly, you can click the “select tag value” button and choose the SSID:
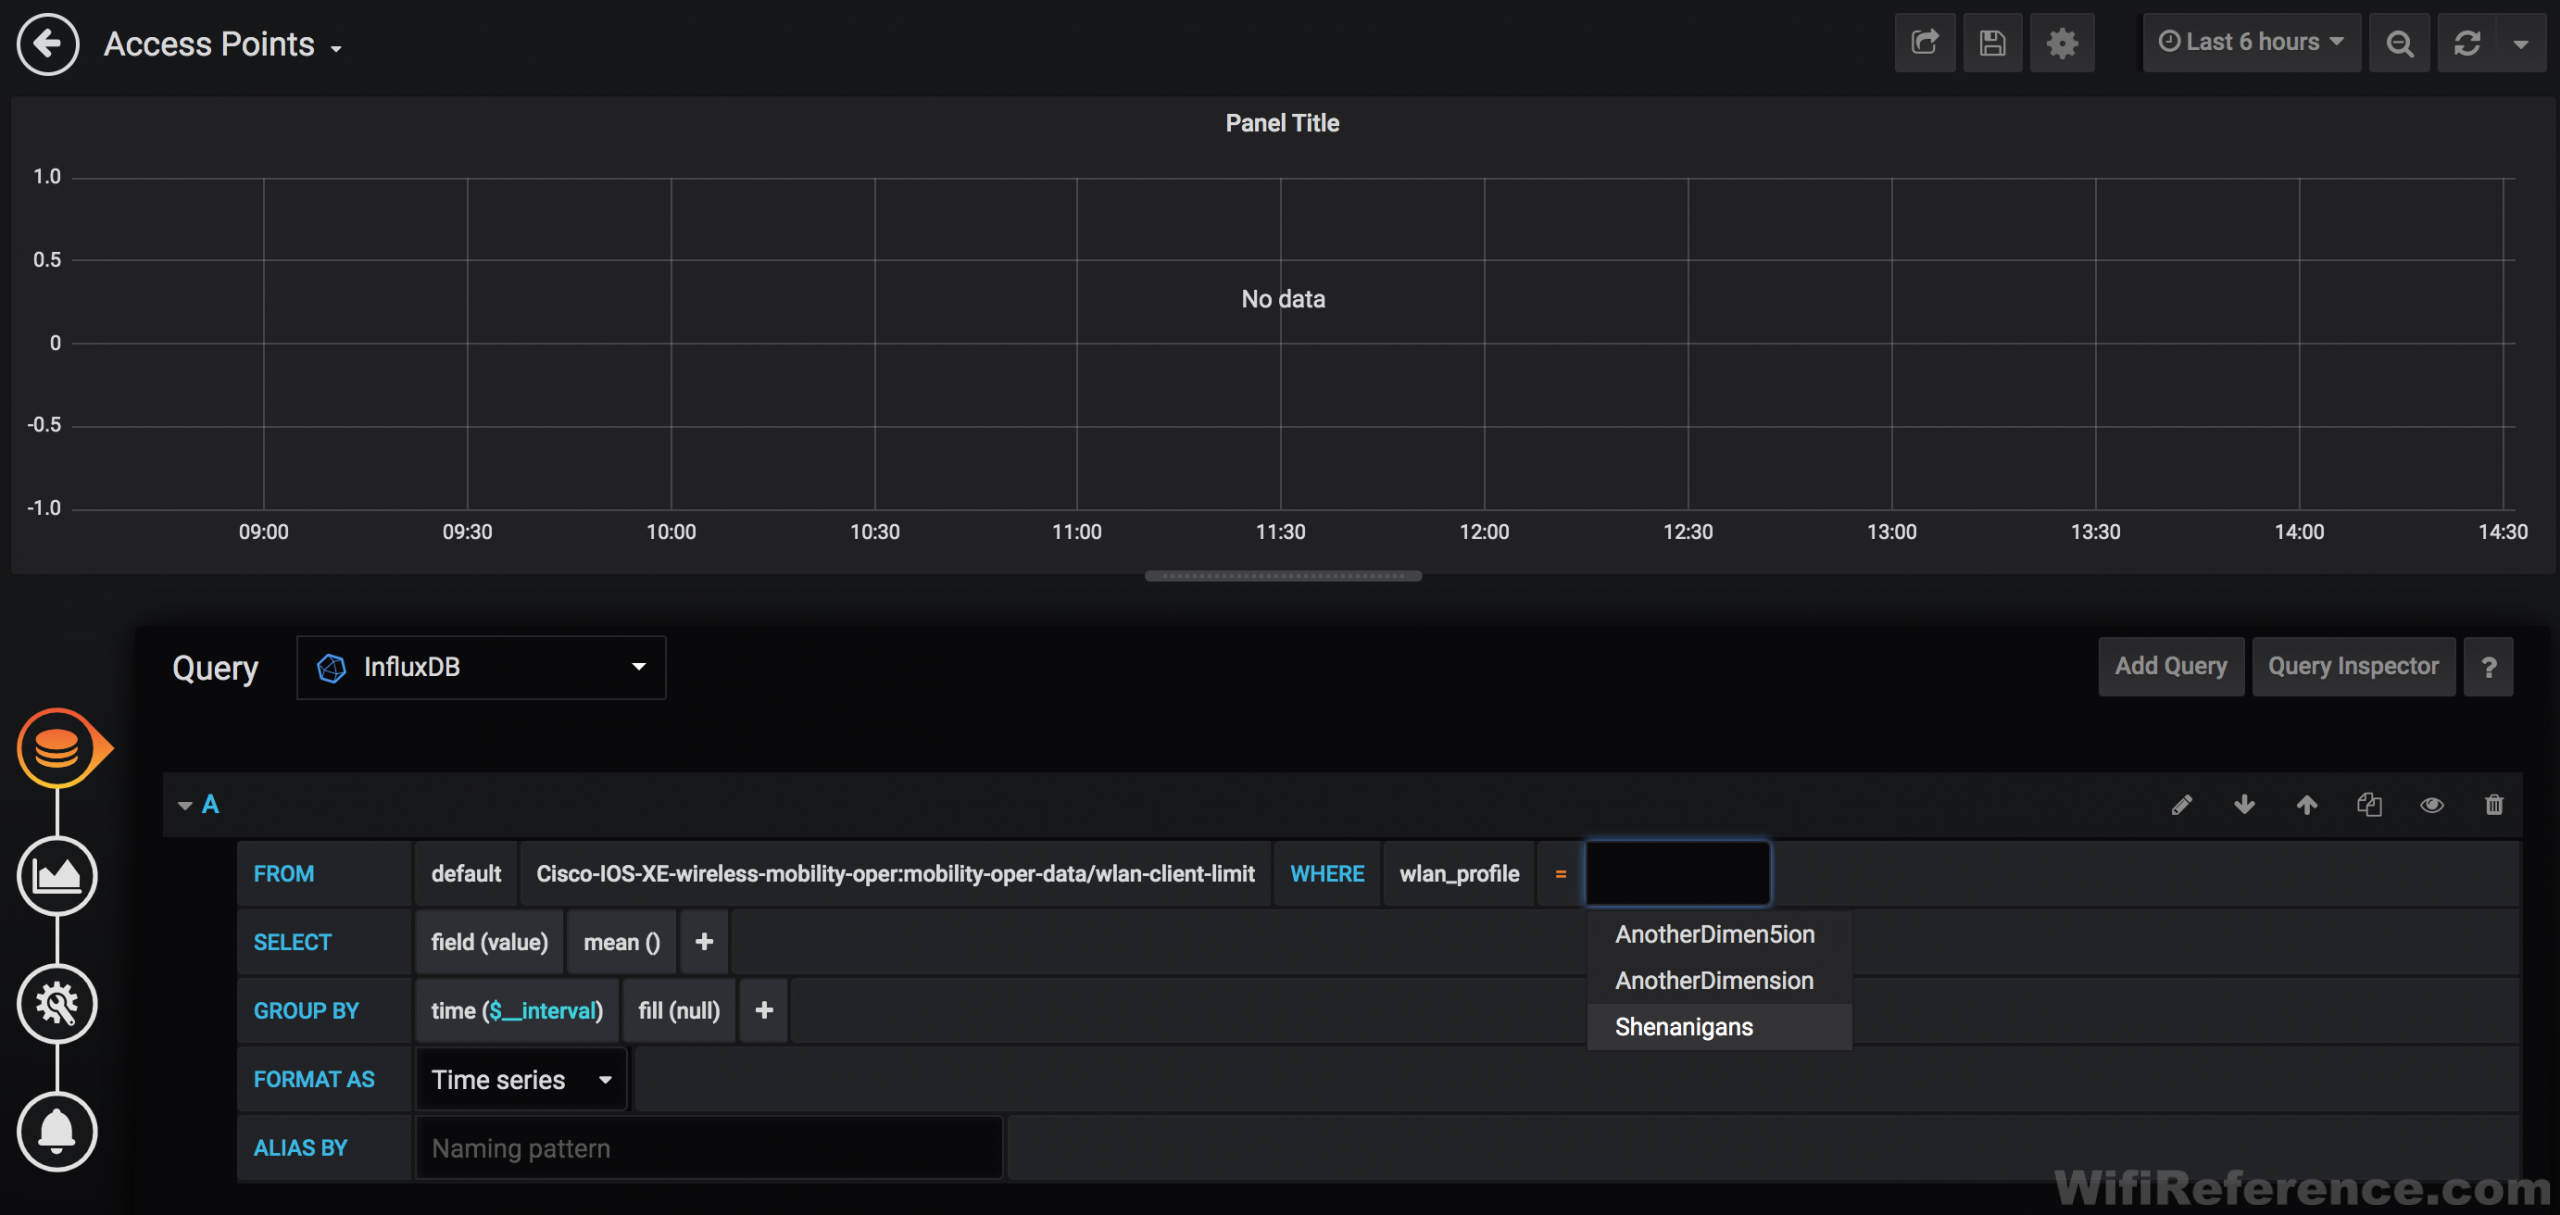
Now you must select the value you are looking for. In this case, we want “curr_clients_count” (which is the only available value in this case):
We are interested in the last known value for curr_clients_count, so click the + symbol at the end of the SELECT line, and choose Selectors, last:
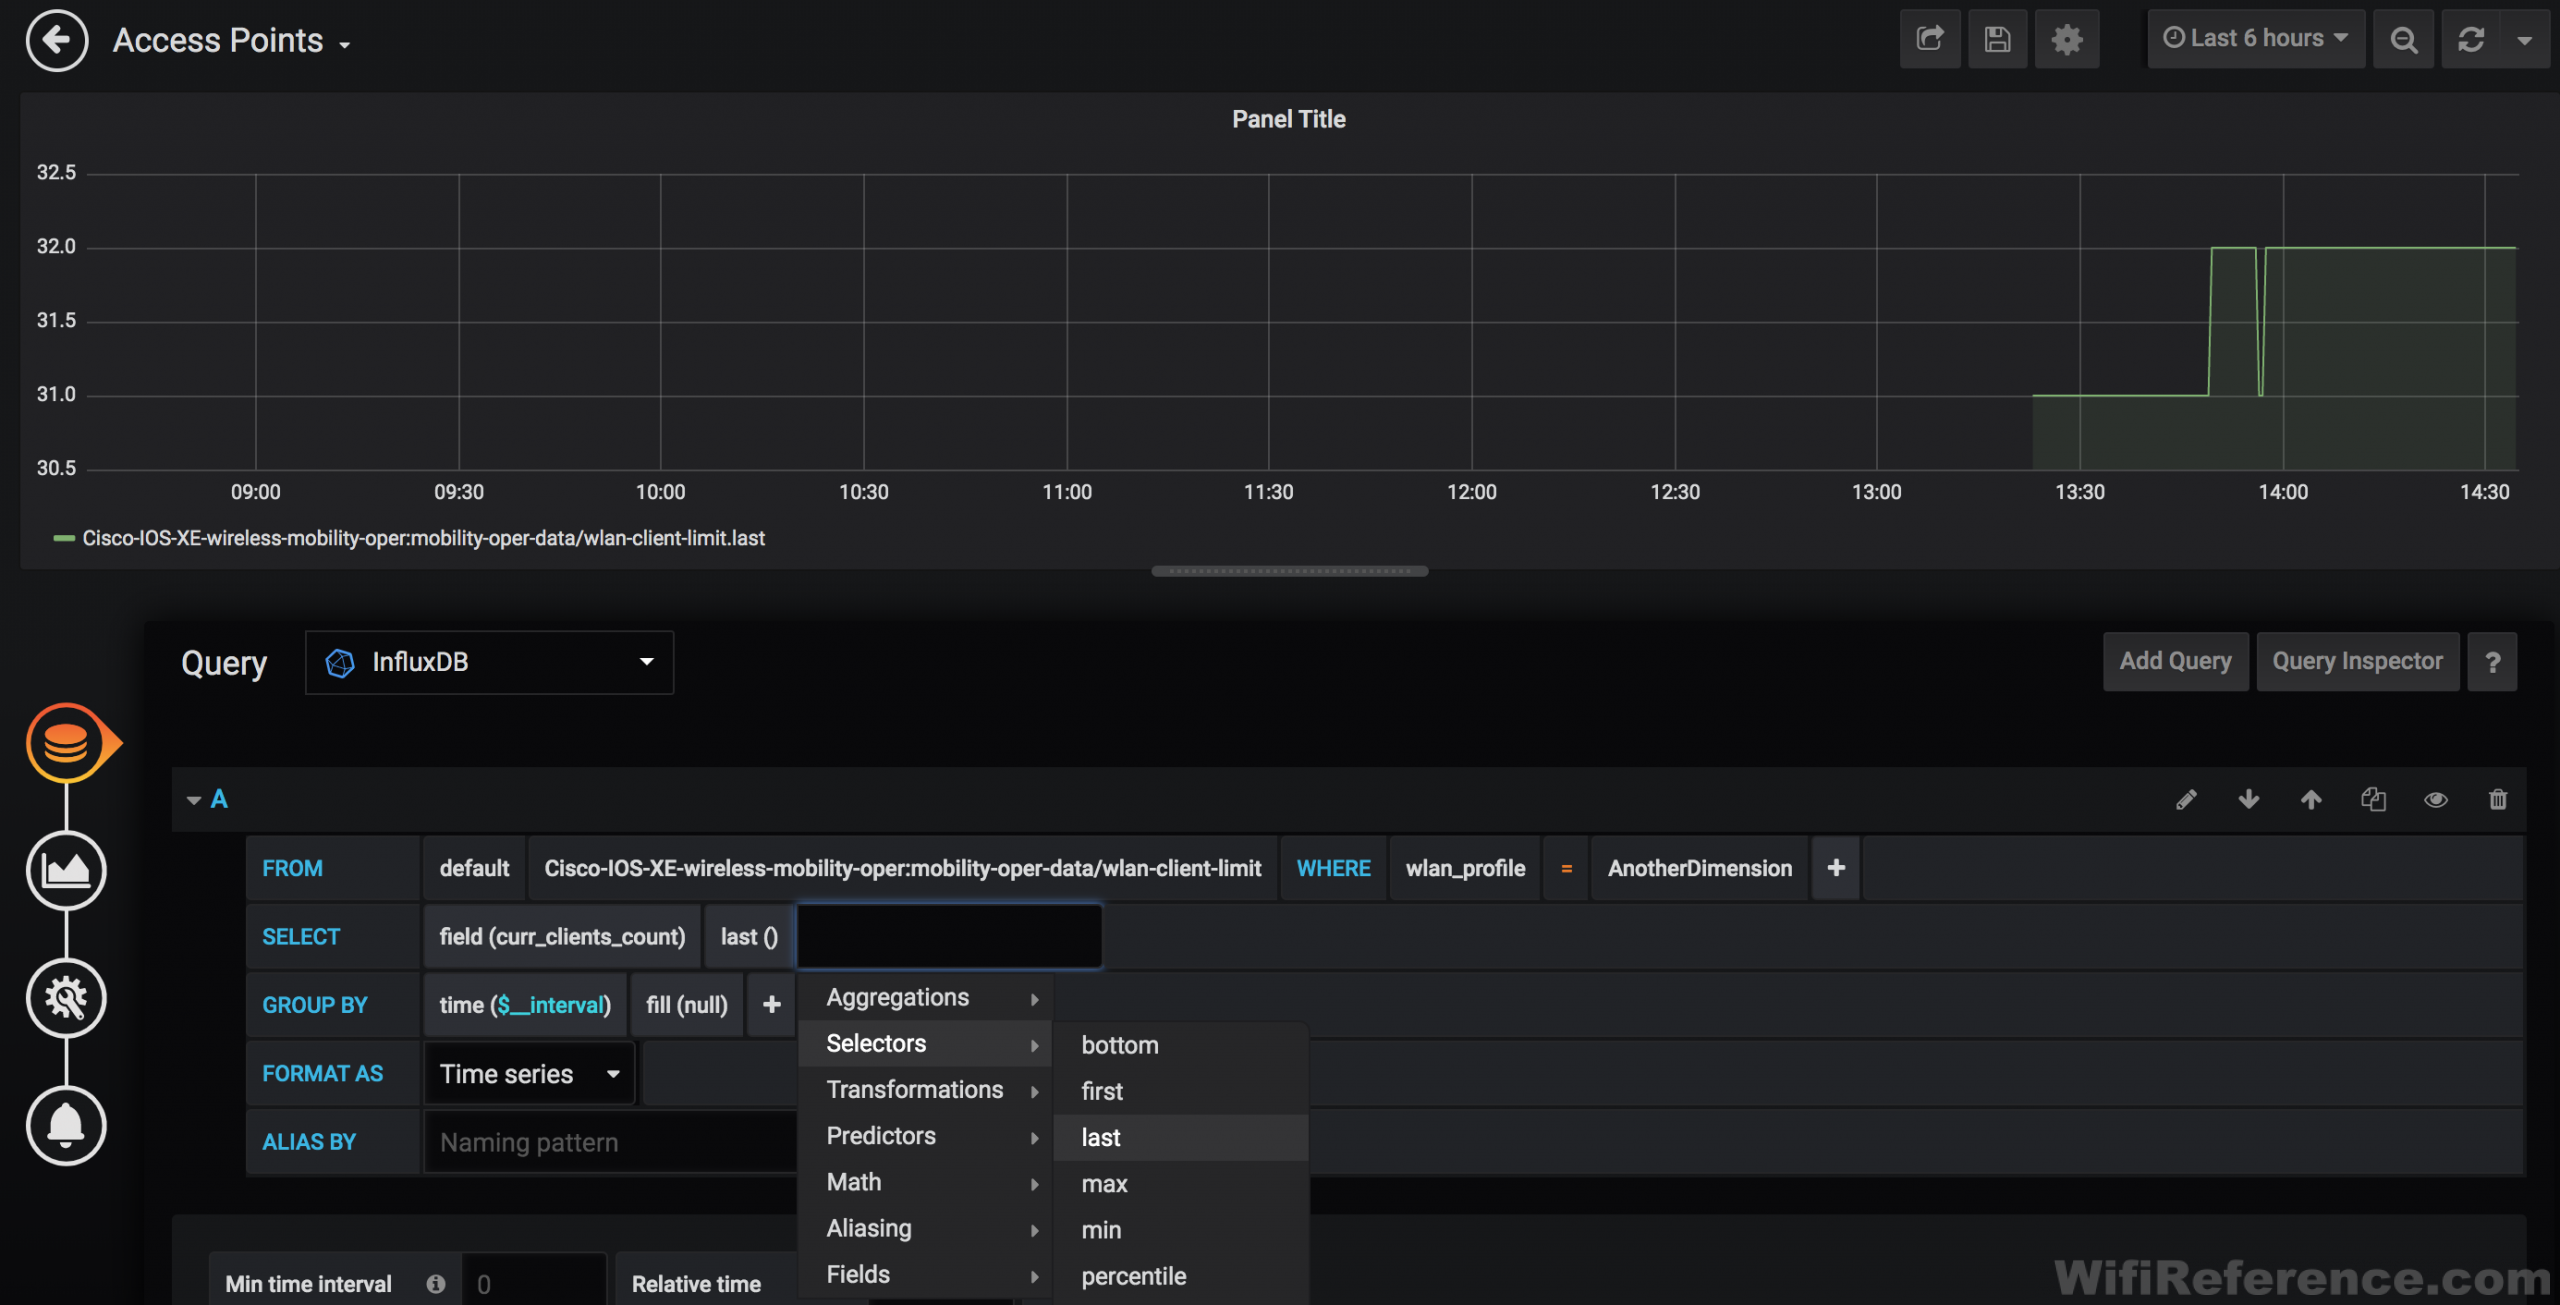
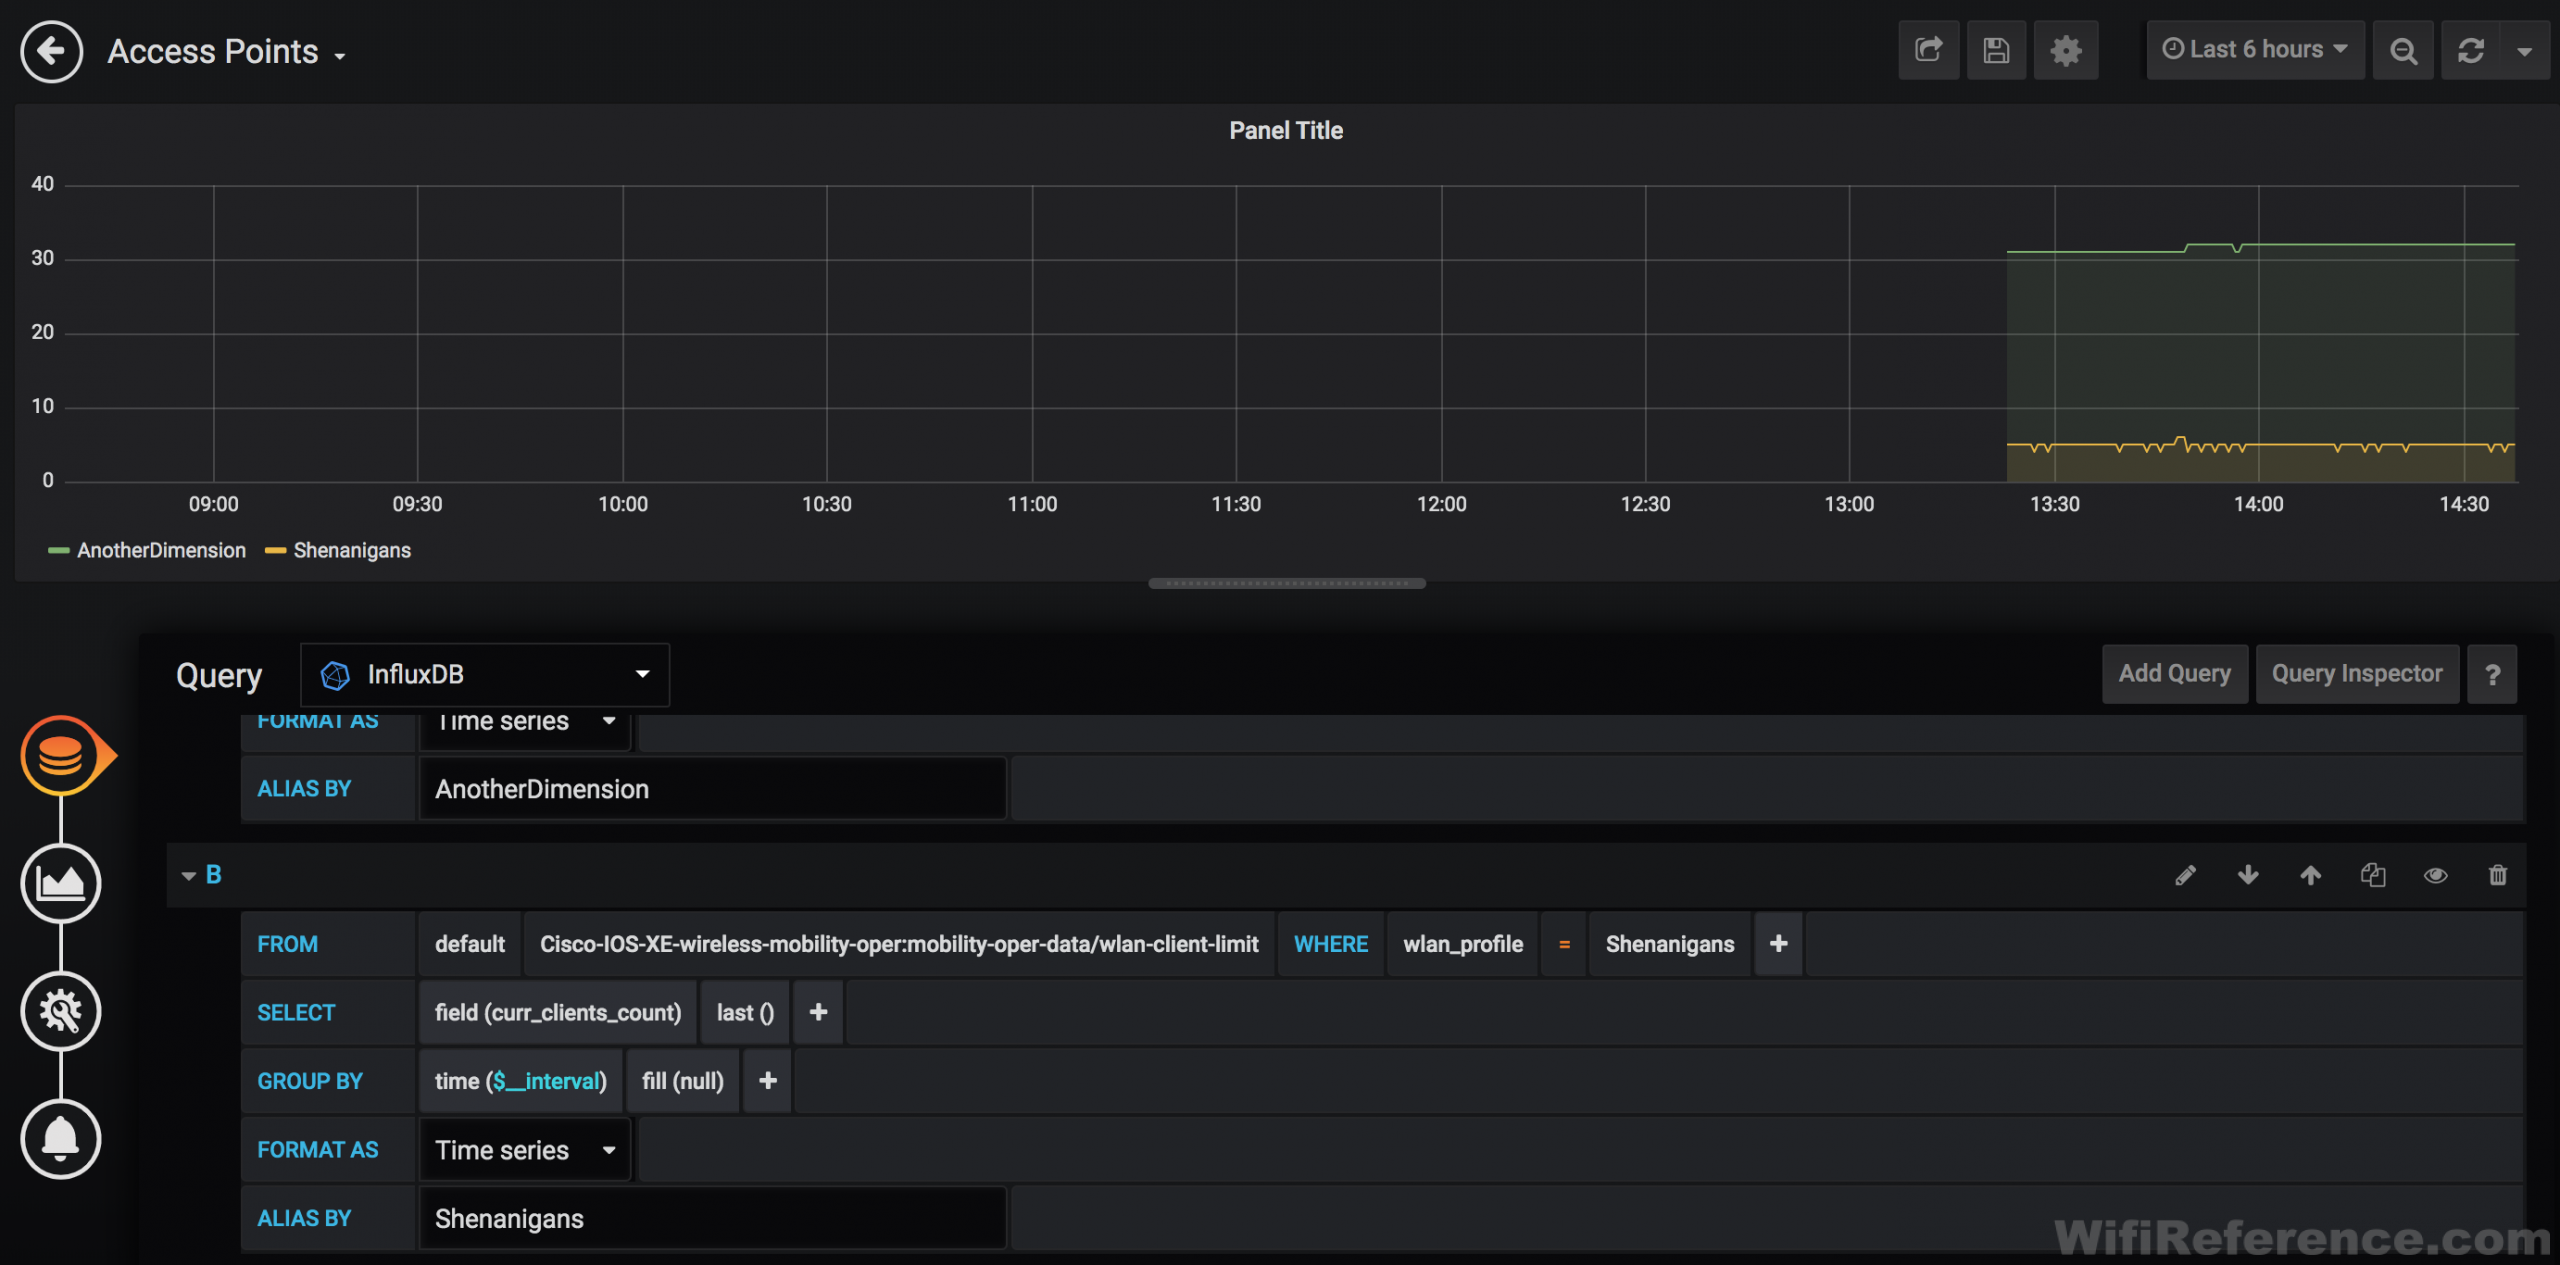
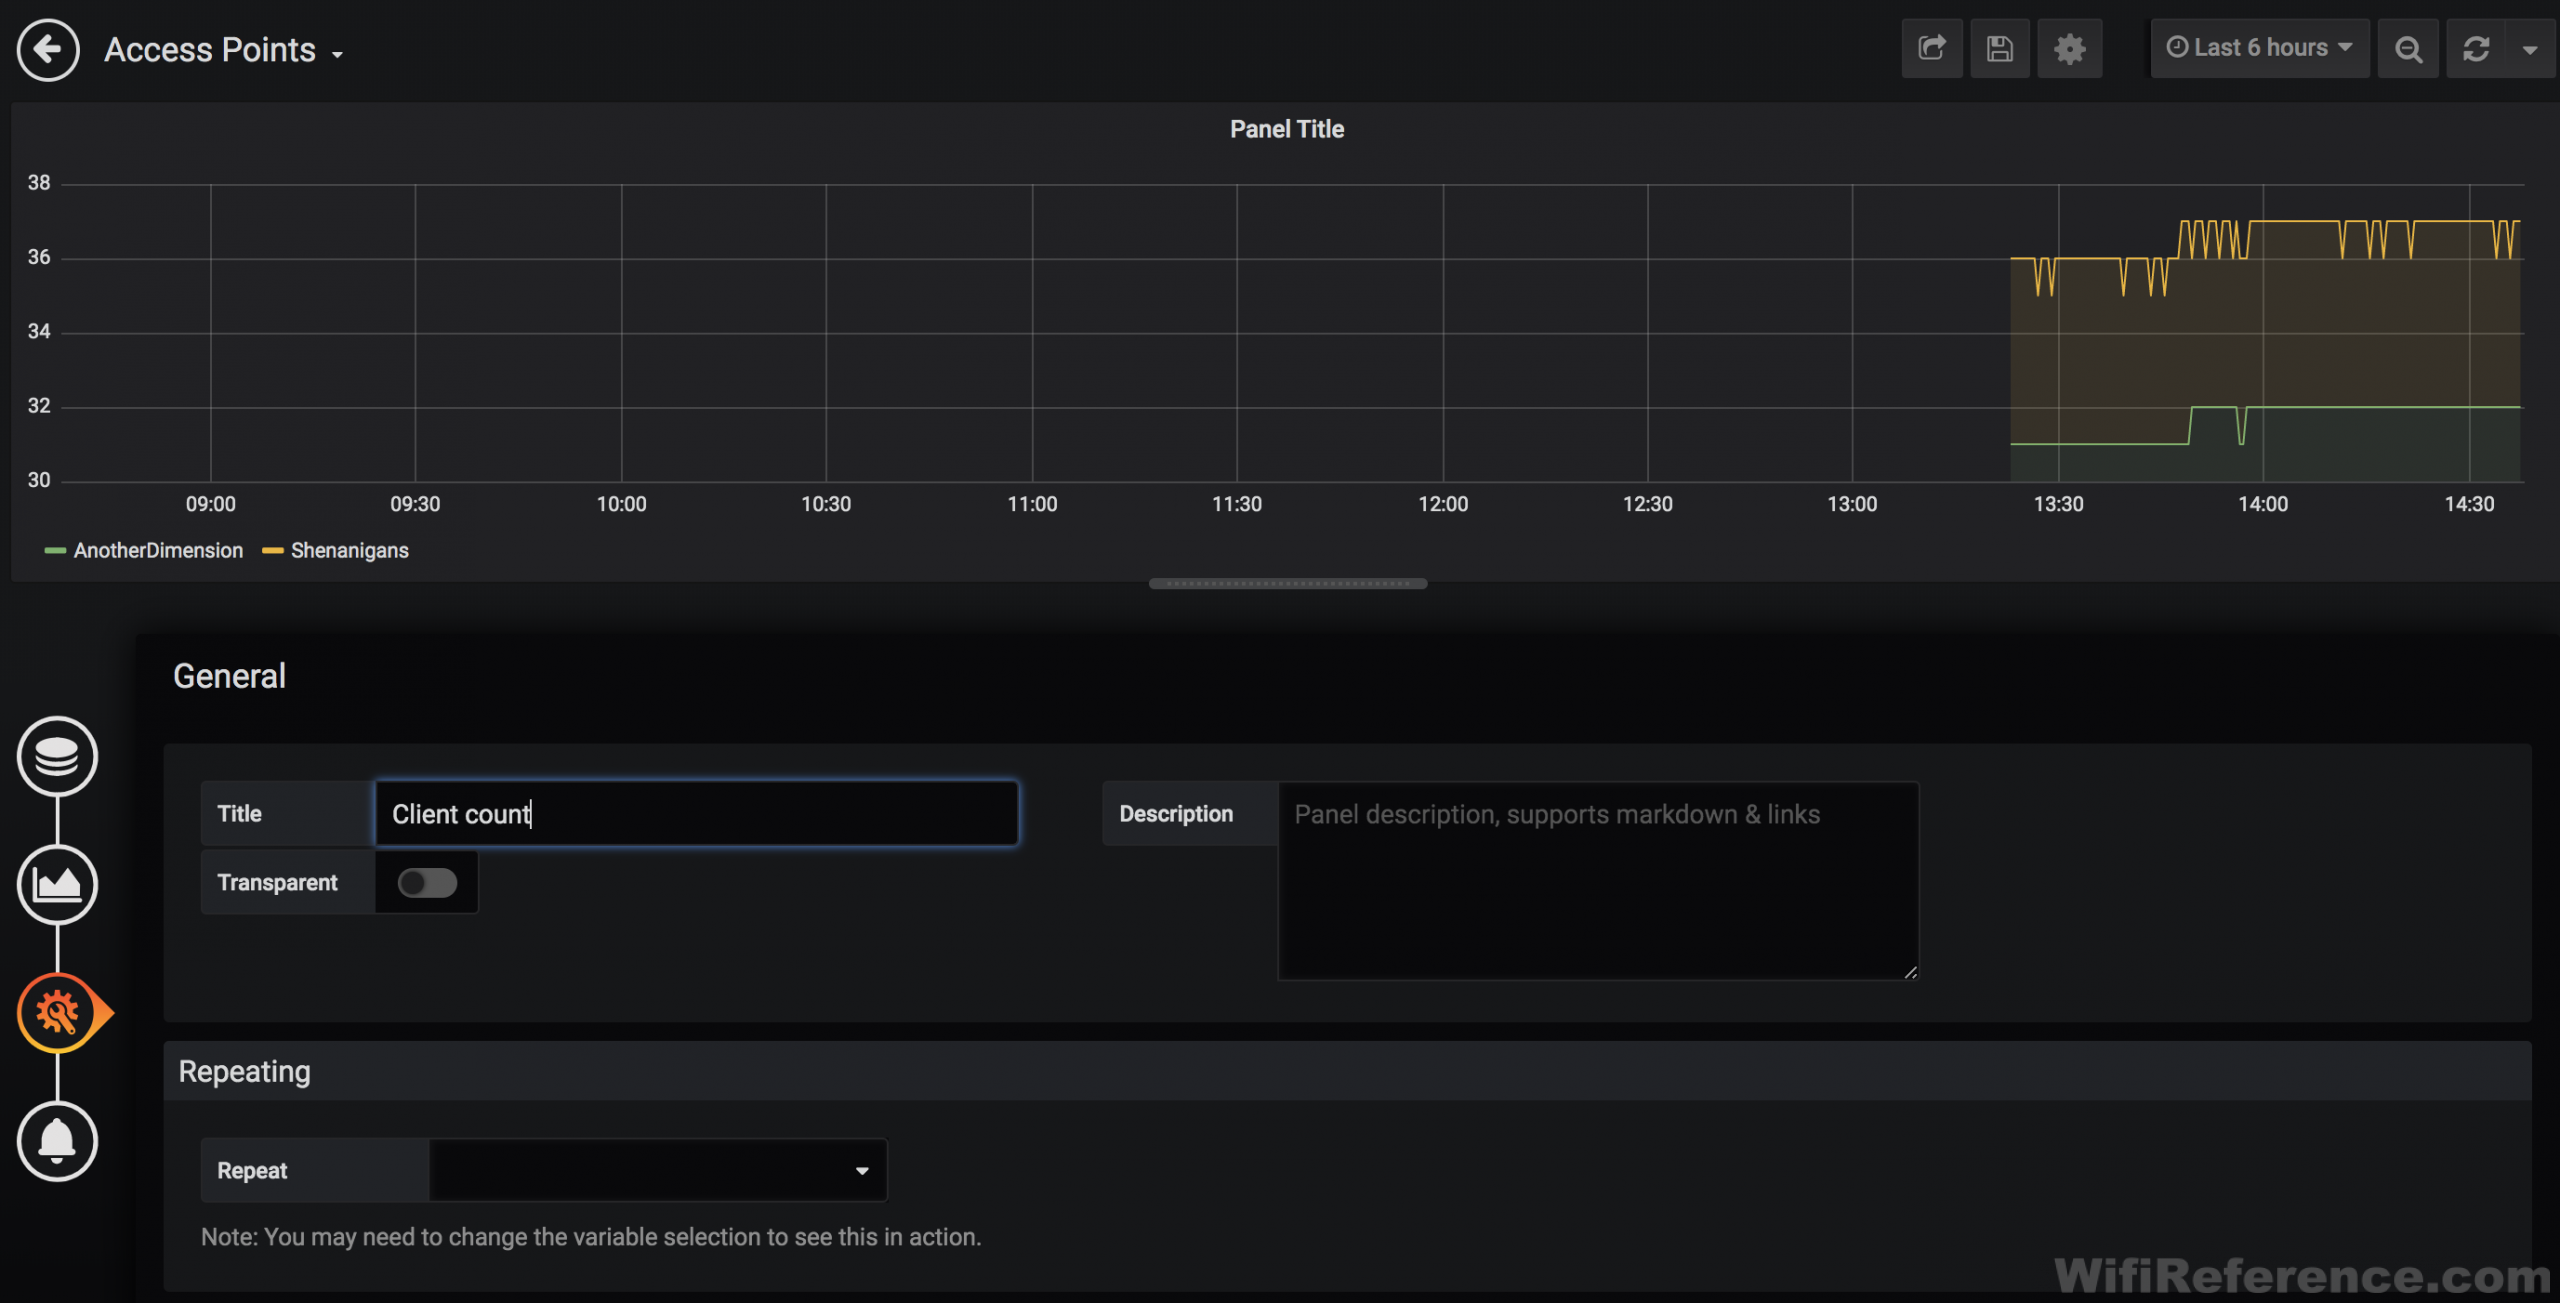
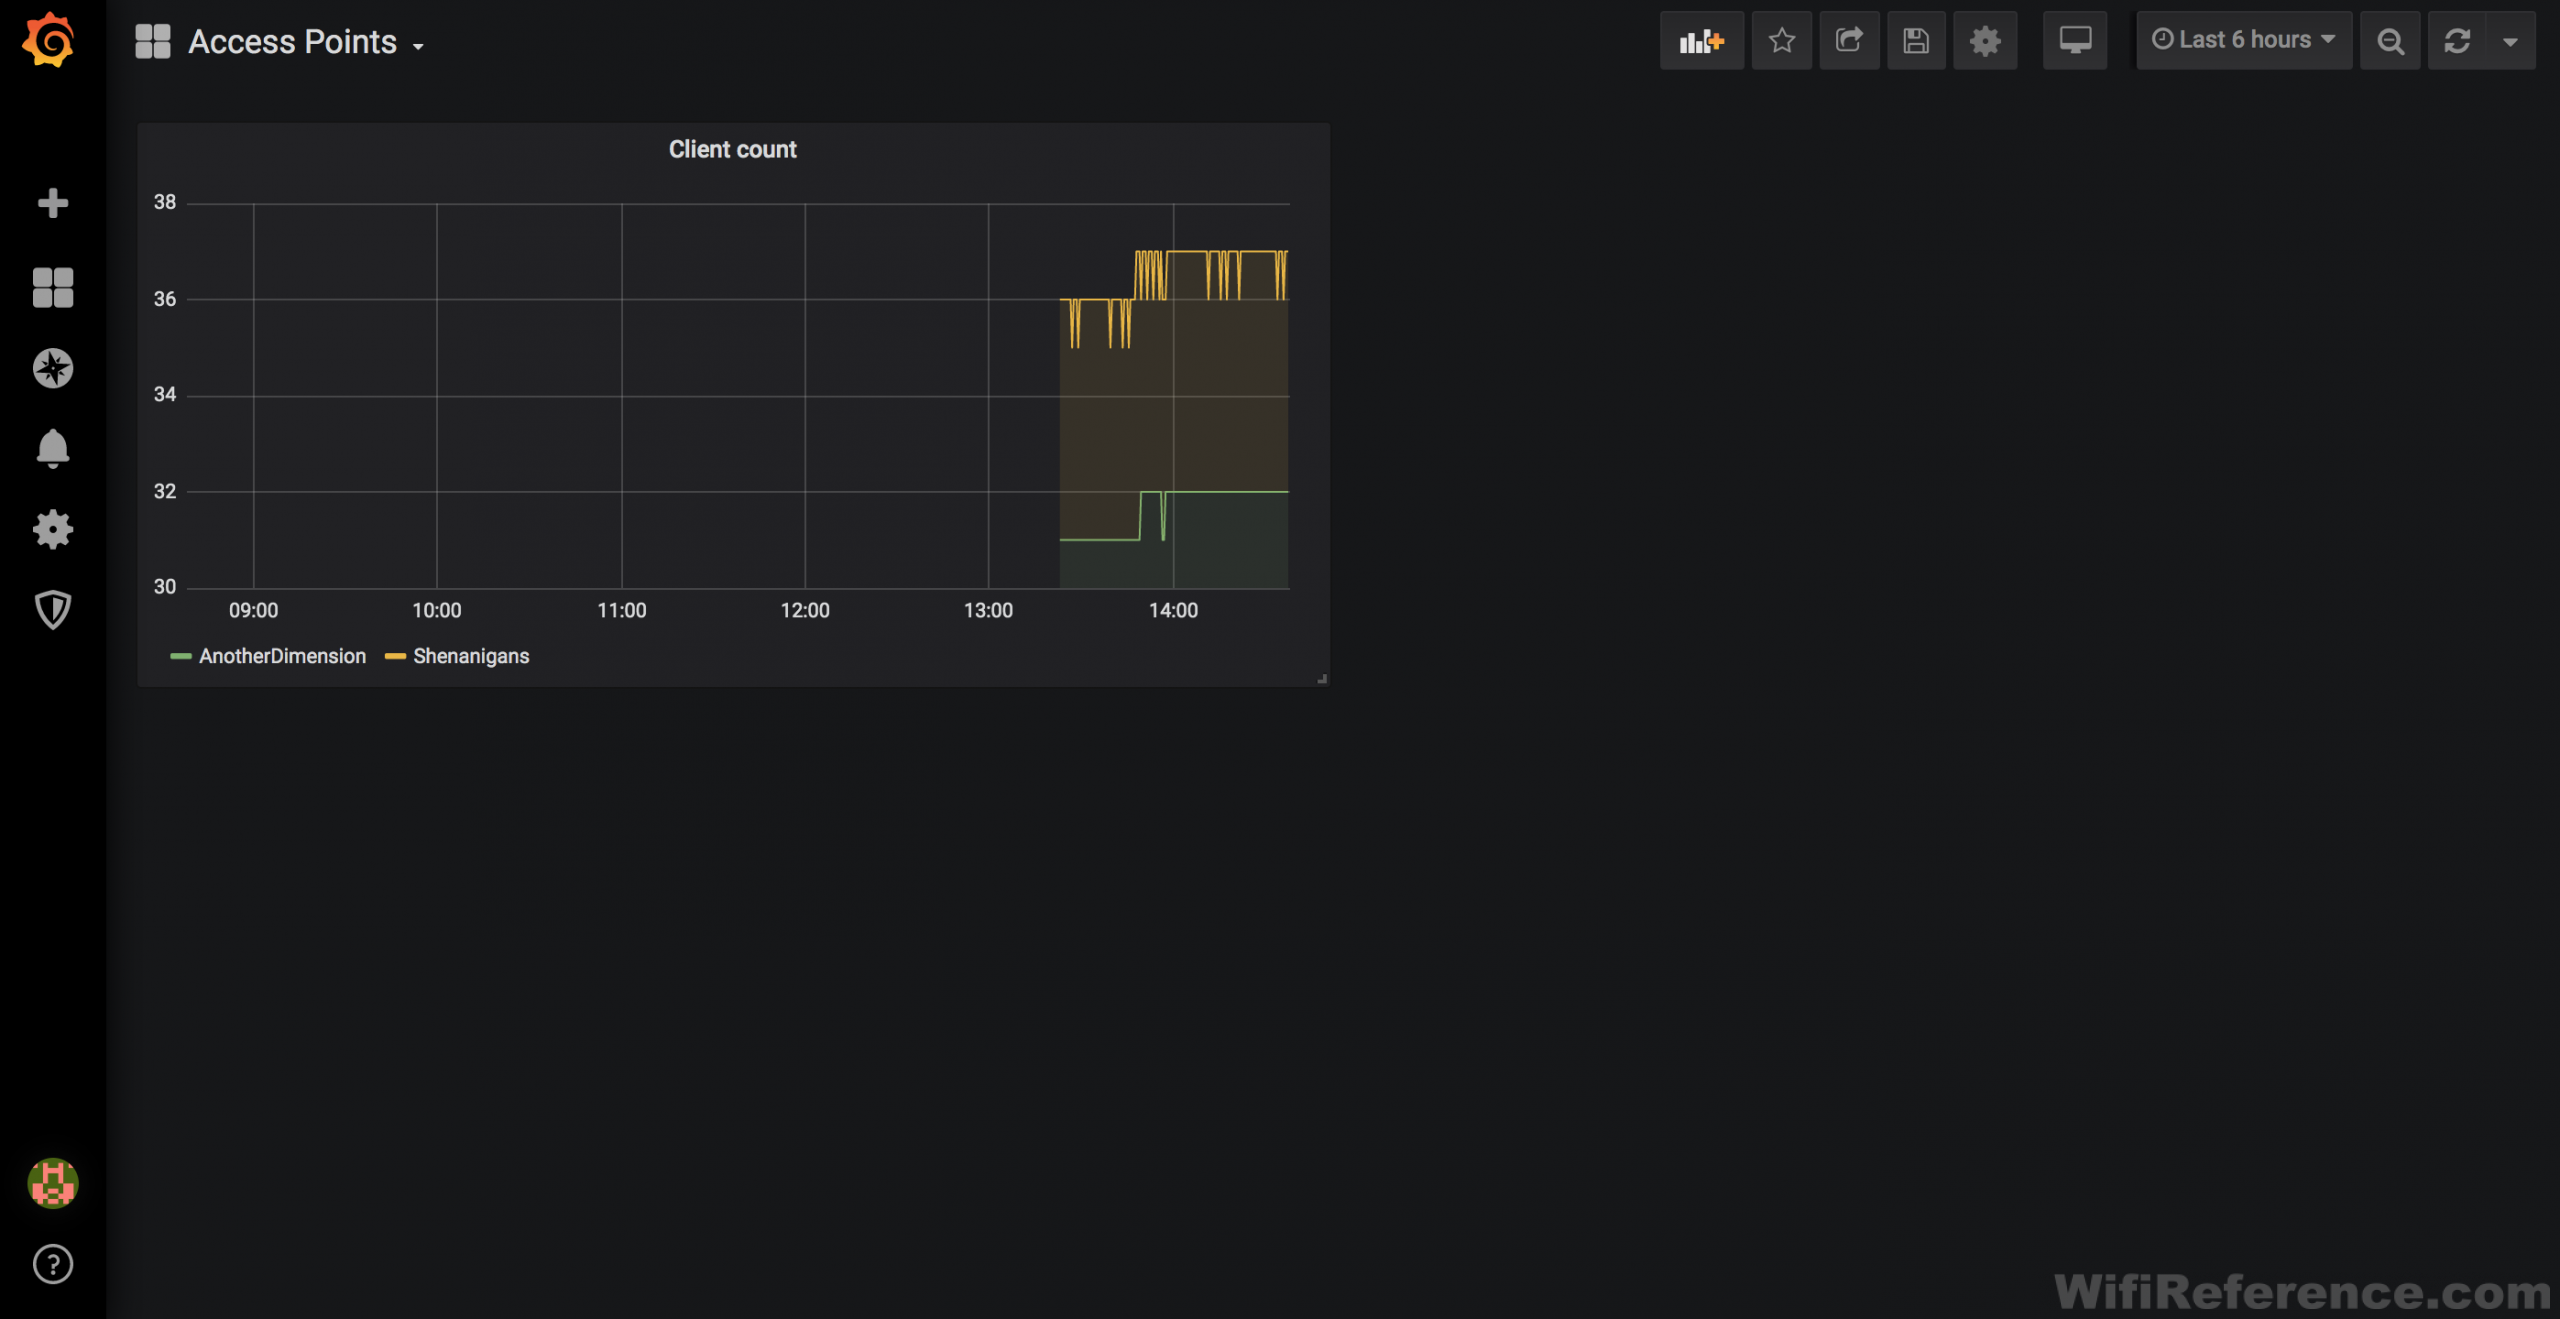
You should now start to see data plotted on the chart, if you have clients connected to that SSID. Type the name of the SSID into the “Alias by” field, so that it shows up in the Legend properly. Then click the duplicate button on the right side of the query editor and repeat the process for each SSID you want to track.
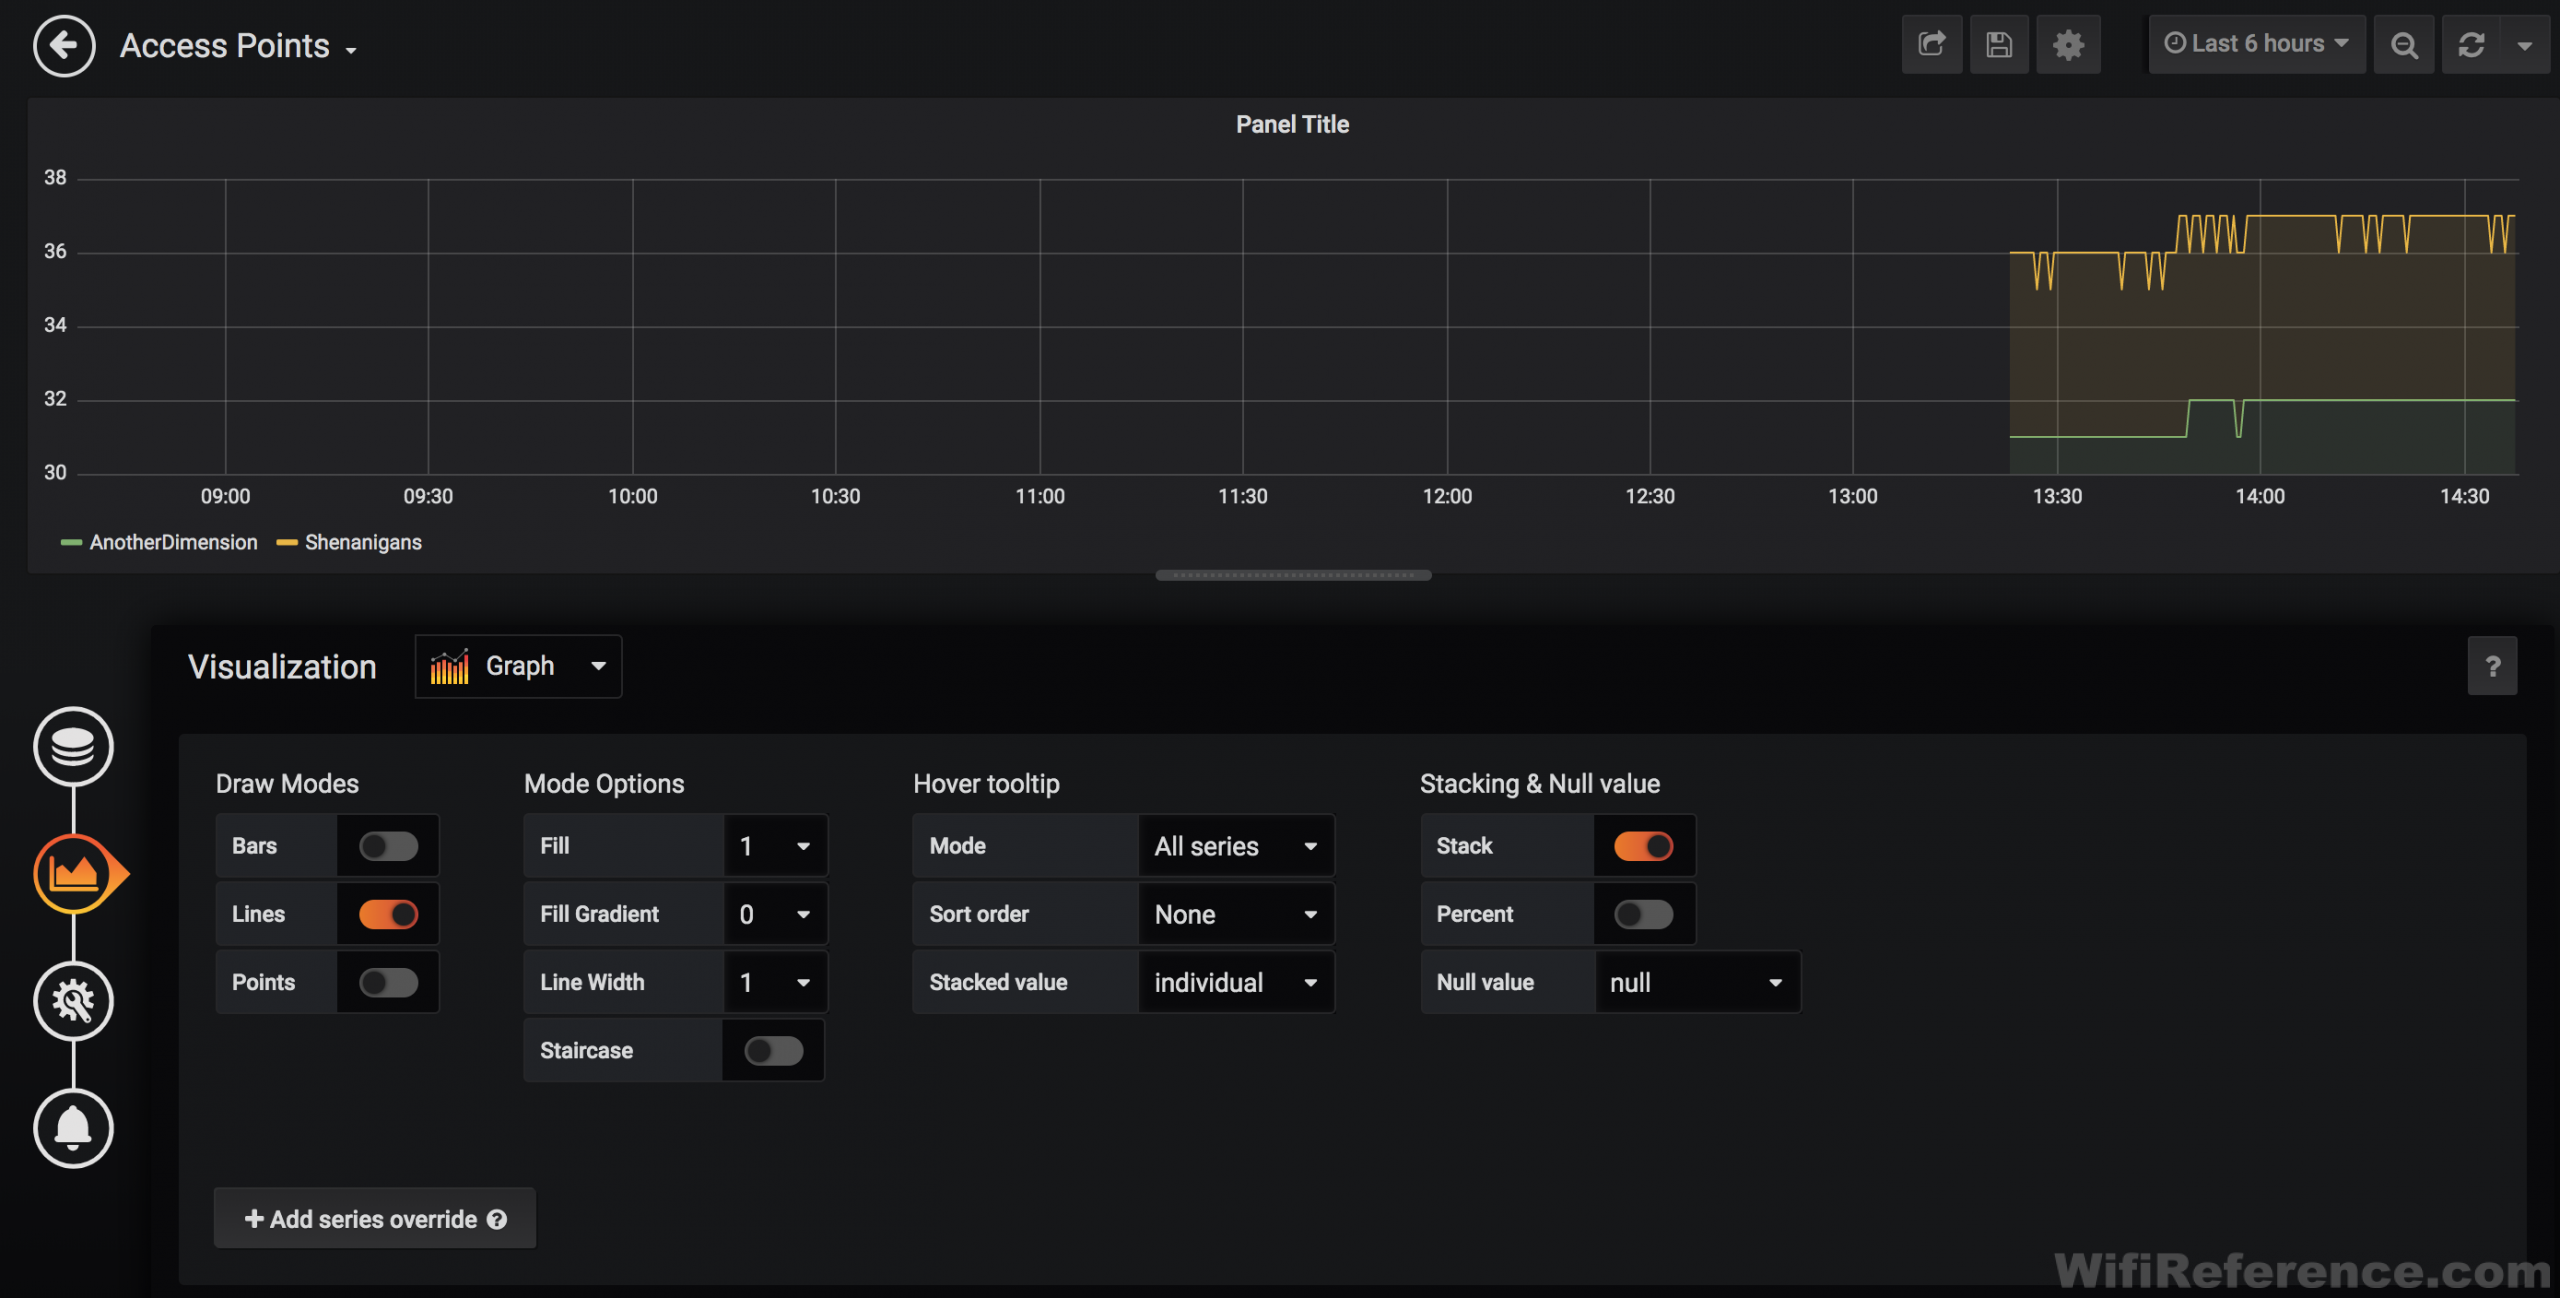
To change the way the chart looks, you can click the chart button on the left-hand side of the screen. Here you can change the thickness of the lines, fill gradients, etc. You may choose to “stack” this chart so that the top line represents the total number of clients on your network.
Click the Gear icon on the left-hand side of the screen to give this chart a name:
Click the left arrow in the upper-left corner of the screen to be taken back to your dashboard. Note that you have not saved your work yet. Grafana does not save any of your work unless you click the disk icon in the upper-right. You should do this often.
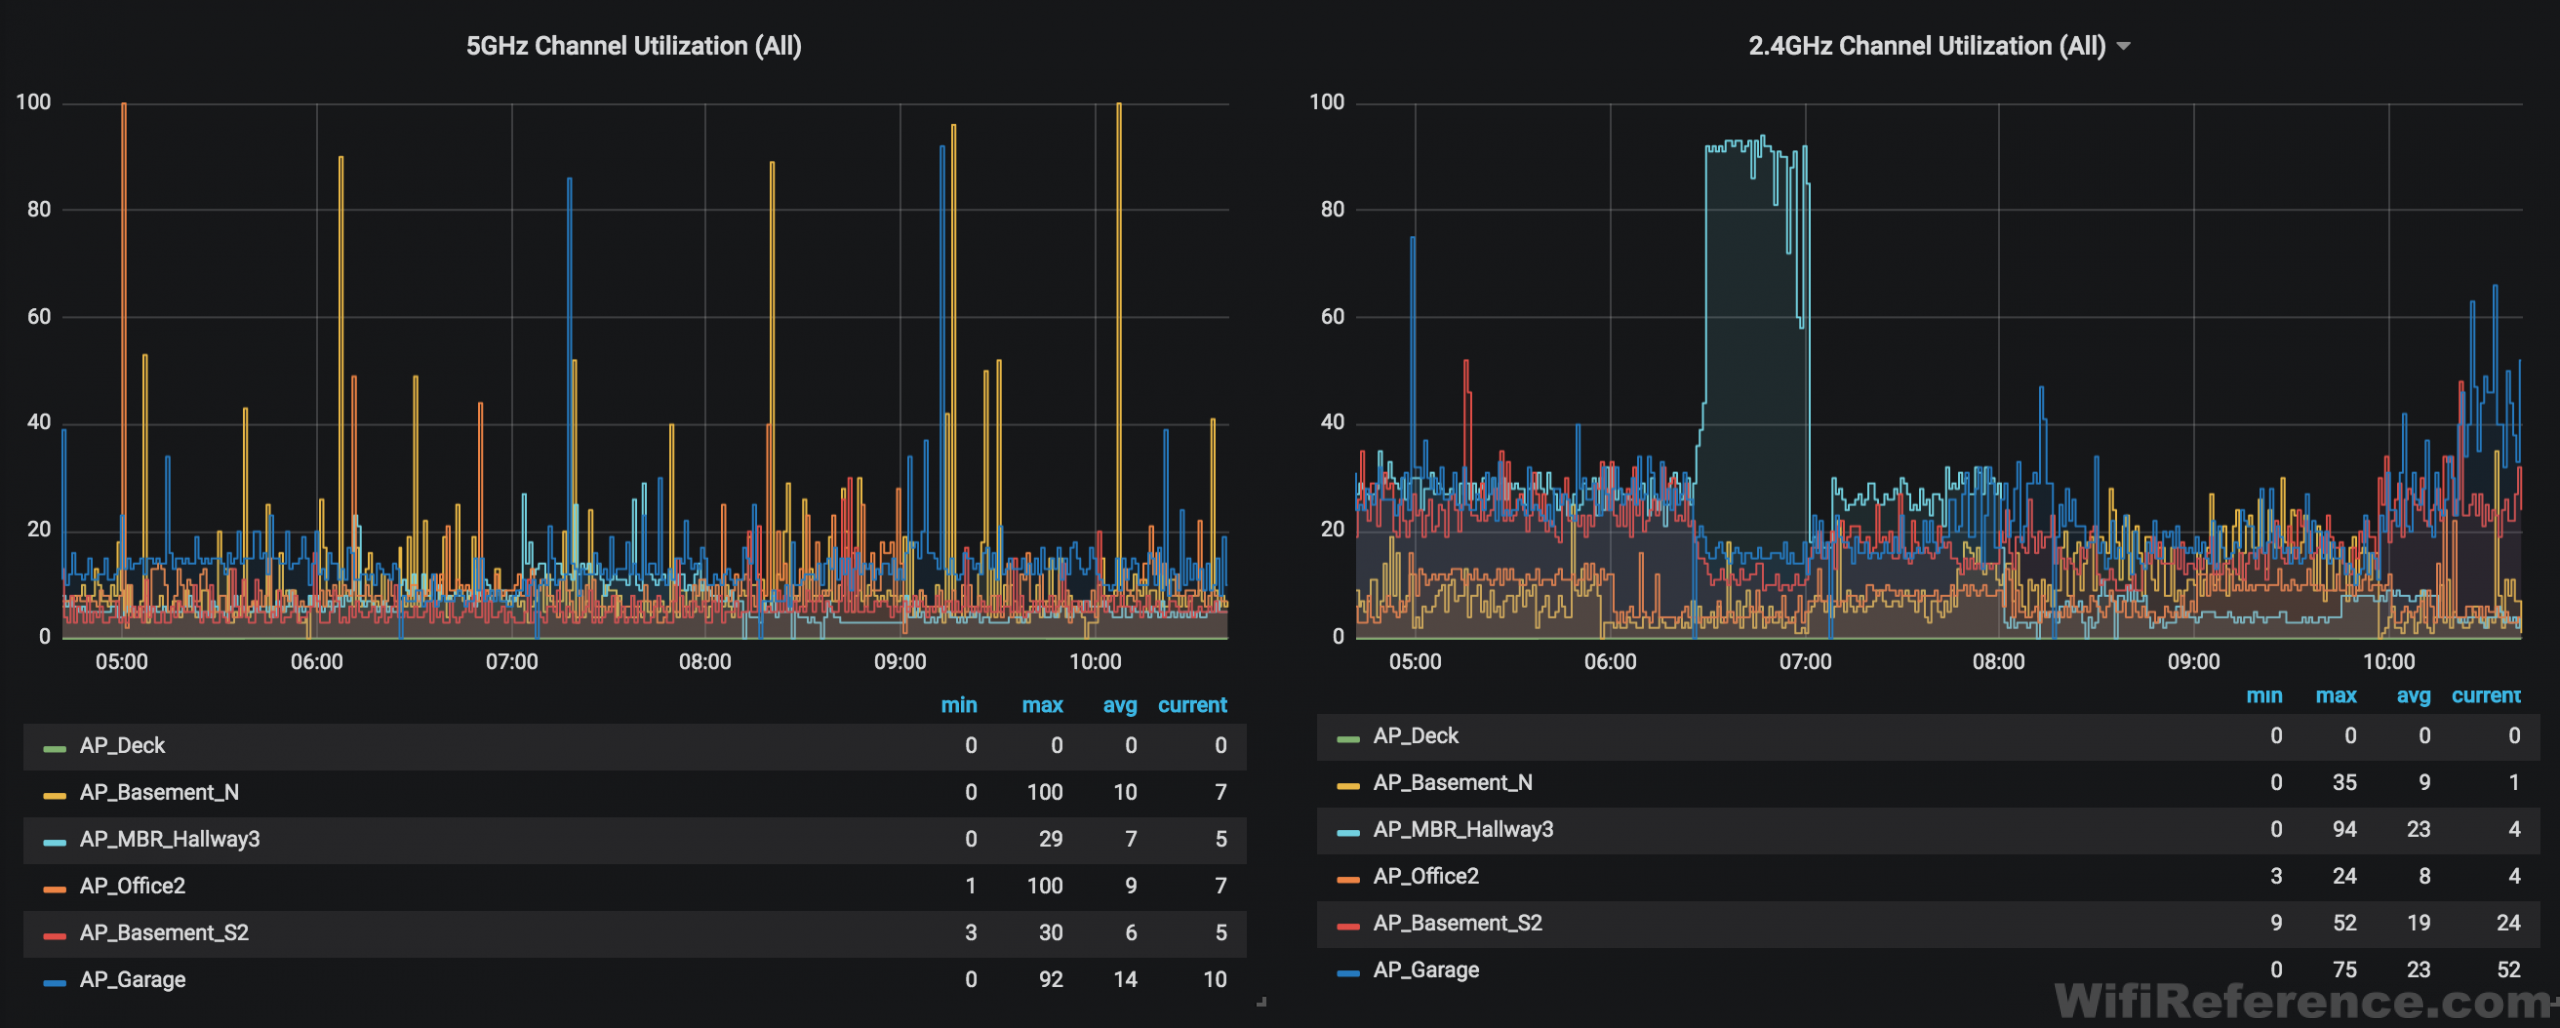
Graphing Channel Utilization
I’ll walk you through an example of how to graph AP Channel Utilization for a single AP. Later, I will show you how to setup variables, which will allow you to select each AP that you want to graph.
Create a new panel and click the Add Query button. Choose InfluxDB from the Query drop-down menu again.
There’s a bunch of specifics to this one, so I will list them out:
- Select measurement: Cisco-IOS-XE-wireless-rrm-oper:rrm-oper-data/rrm-measurement
- WHERE wtp_mac = [MAC of AP]
- AND radio_slot_id = [0 or 1] (0=2.4GHz, 1=5GHz)
- SELECT field (load/cca_util_percentage) last()
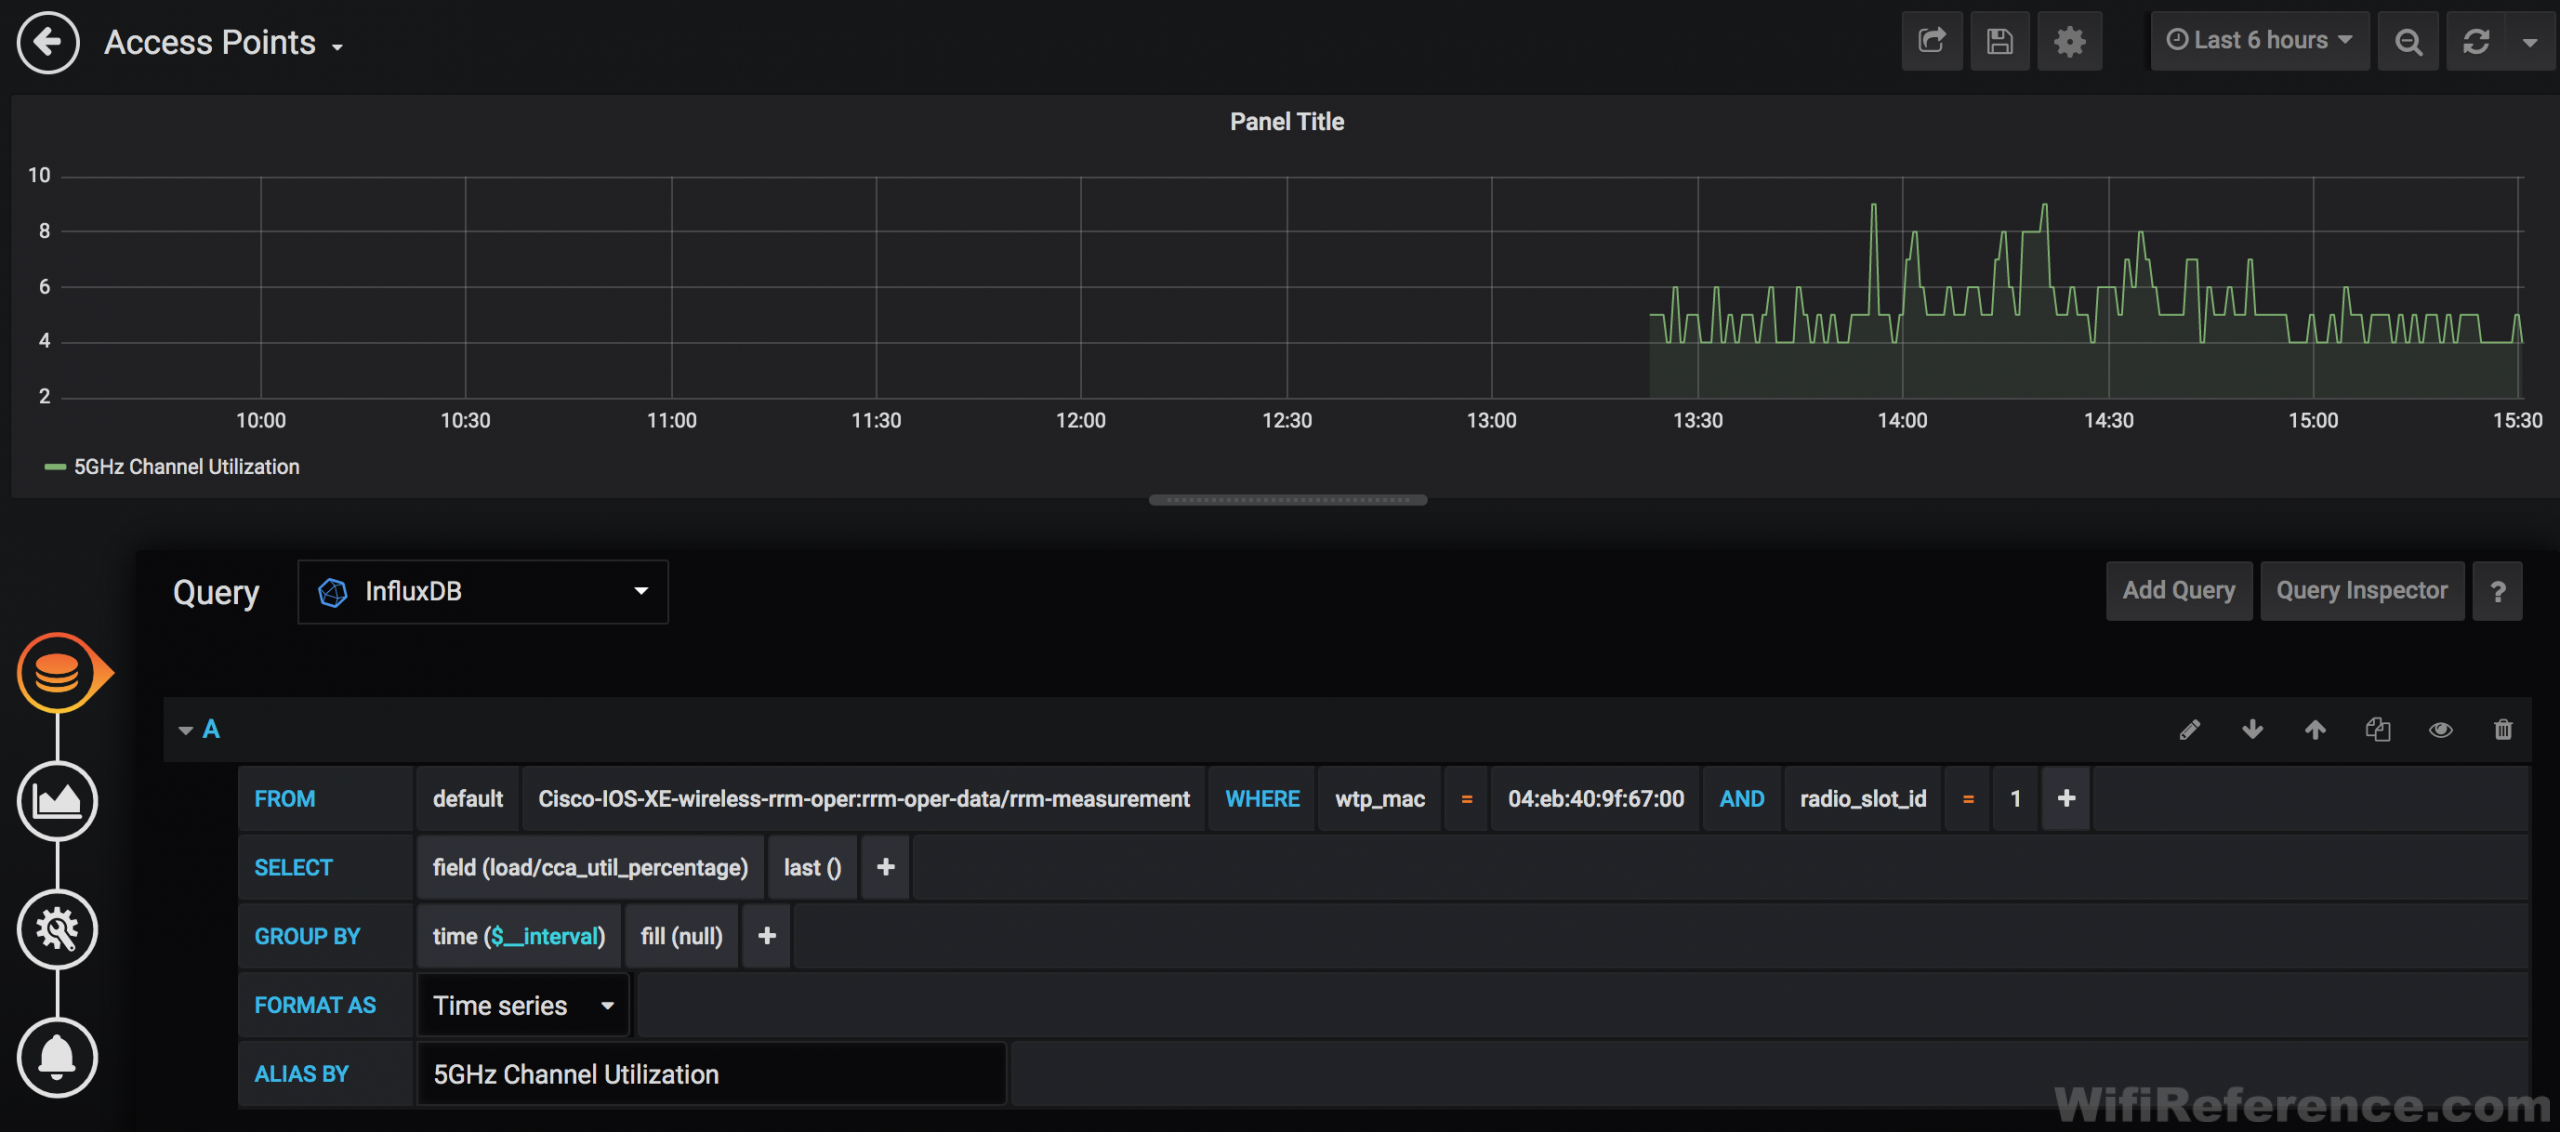
You can duplicate this query for the other radio_slot_id if you want to graph both radios on the same chart. Alternatively, you could duplicate it and graph multiple APs on the same chart, like this:
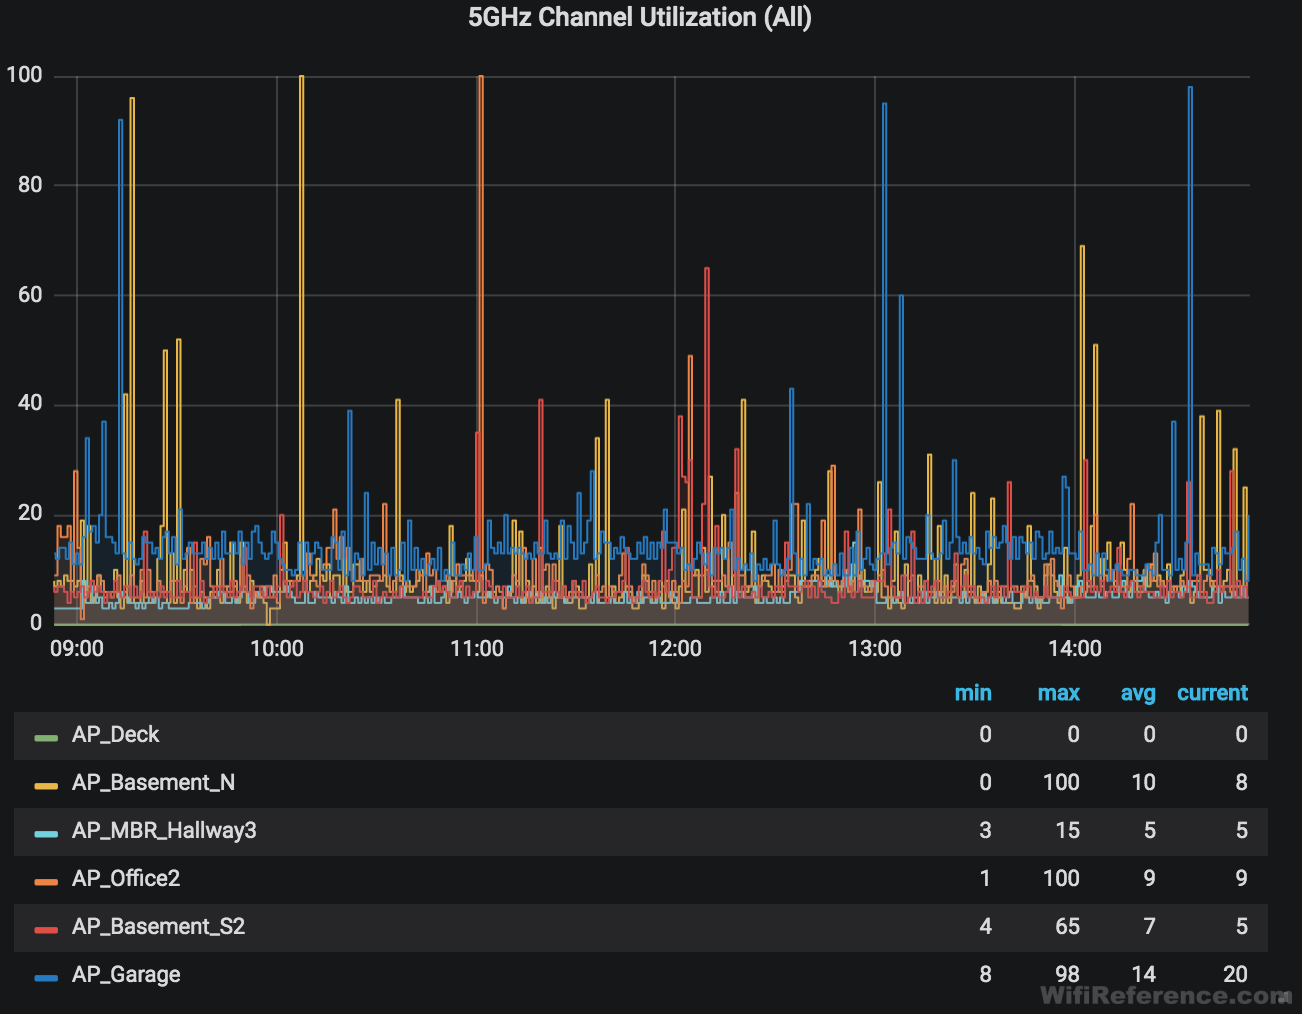
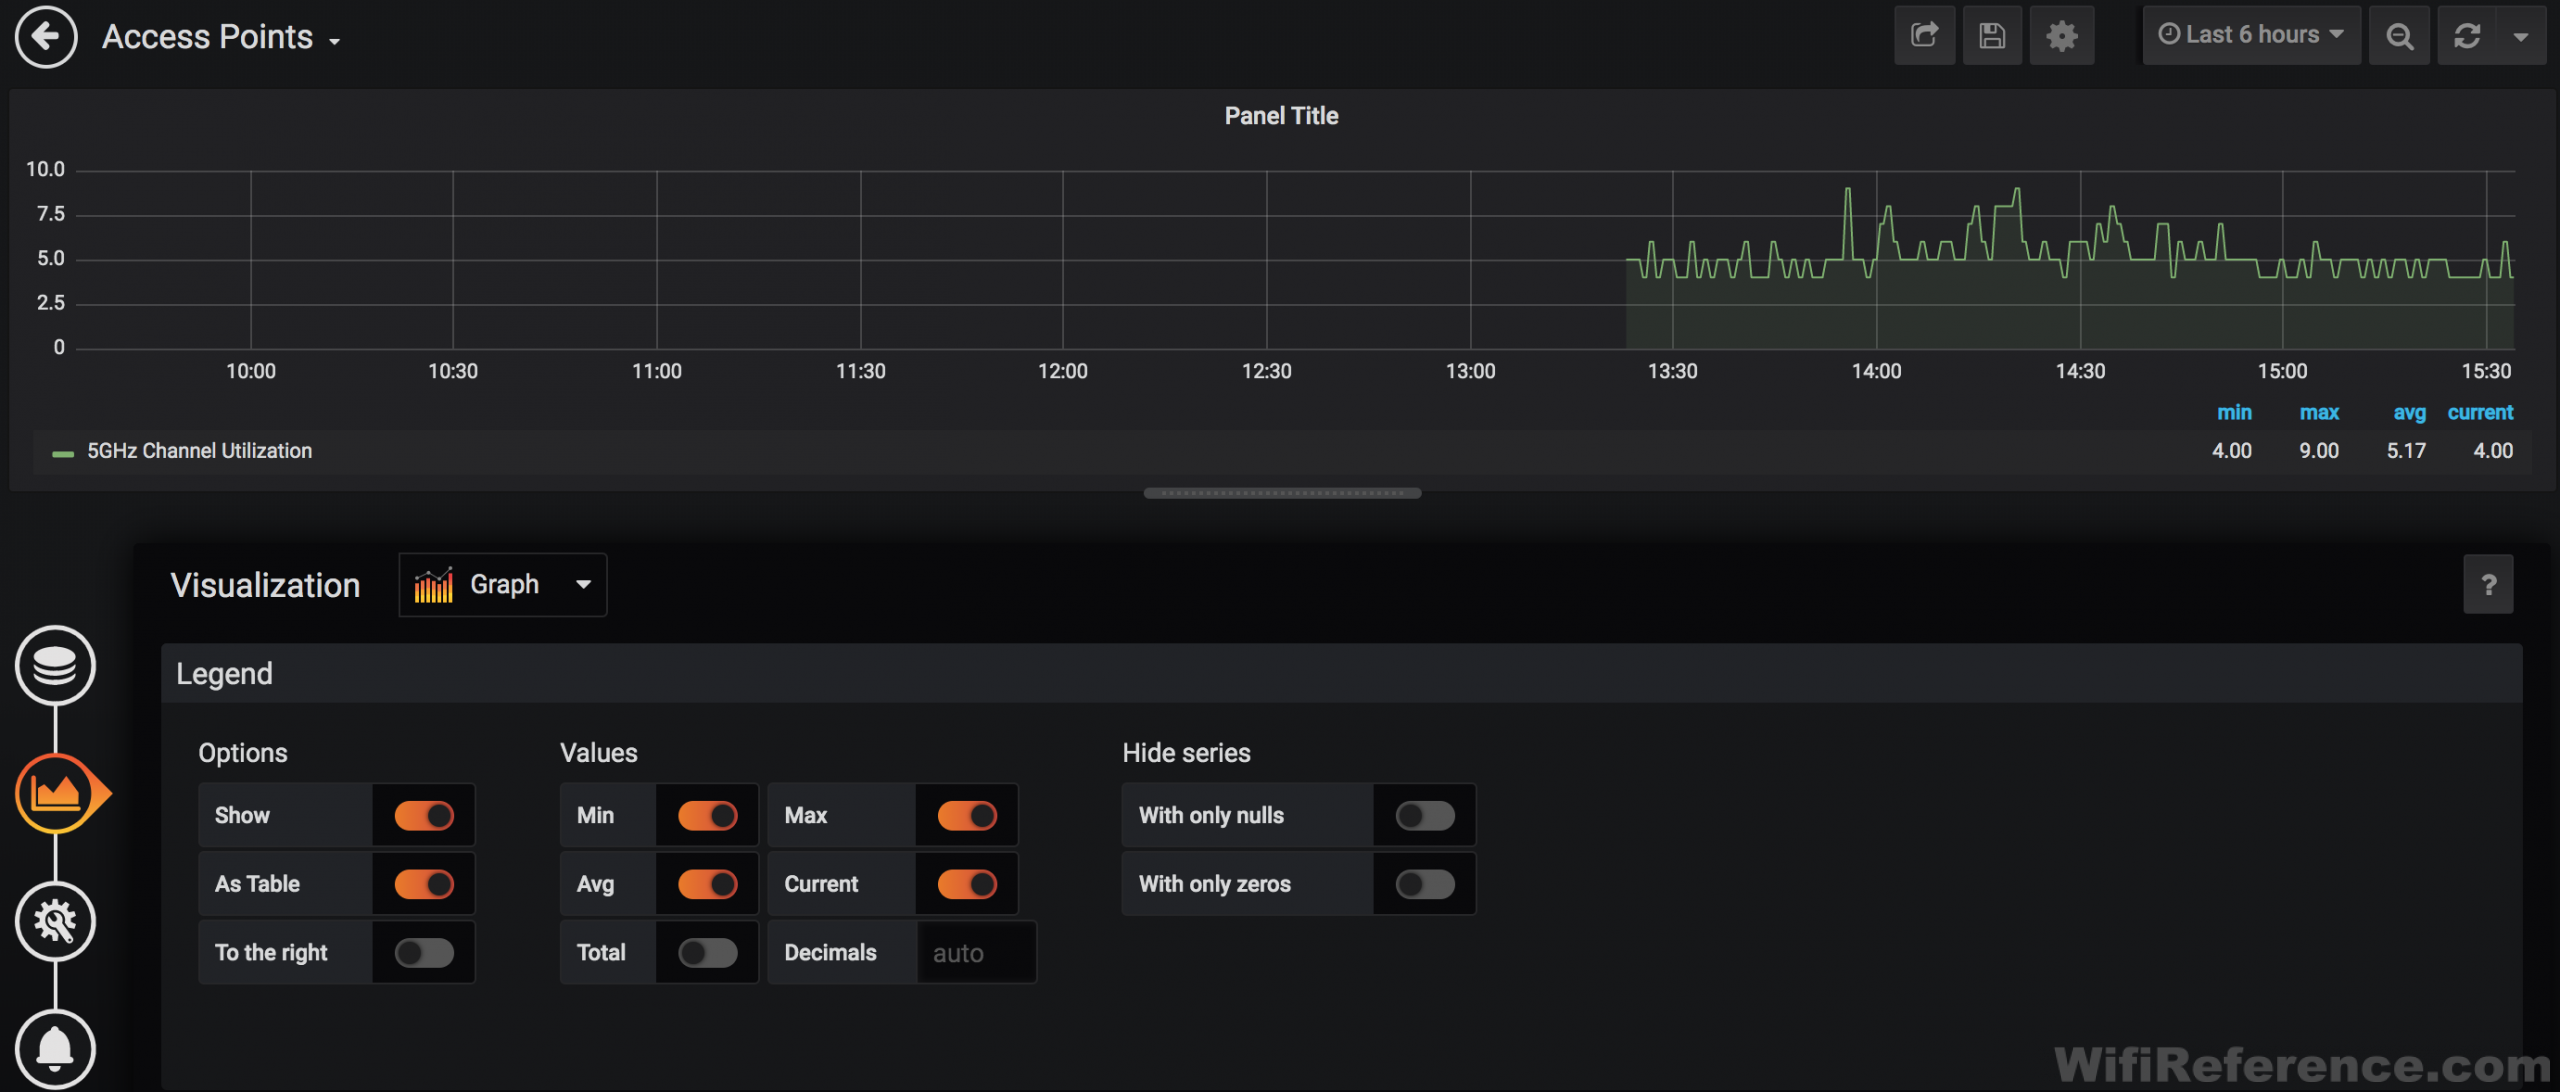
To change the legend so that it shows more information, click the chart button on left side of the screen, and scroll down to the Legend section. You can enable different values here, as well as have the legend shown as a table (as you see above).
Variables
Grafana supports the use of variables in queries. Variables are the key to making an effective dashboard that you can use ongoing. Variables allow you to have a drop-down box at the top of the dashboard to select data to be used in the queries. Things like Client, AP, Band, Username can be set as variables, and then selected in drop-down menus and the charts will react to those selections.
We’re actually going to create a few variables here (used for different purposes). It’s important to understand that variables are only bound to the dashboard you create them in. If you create a separate dashboard for your client graphs, be sure to create the client-related variables on that dashboard.
To configure variables, click on the Gear button in the upper-right corner of the screen (this is the Dashboard Preferences page).
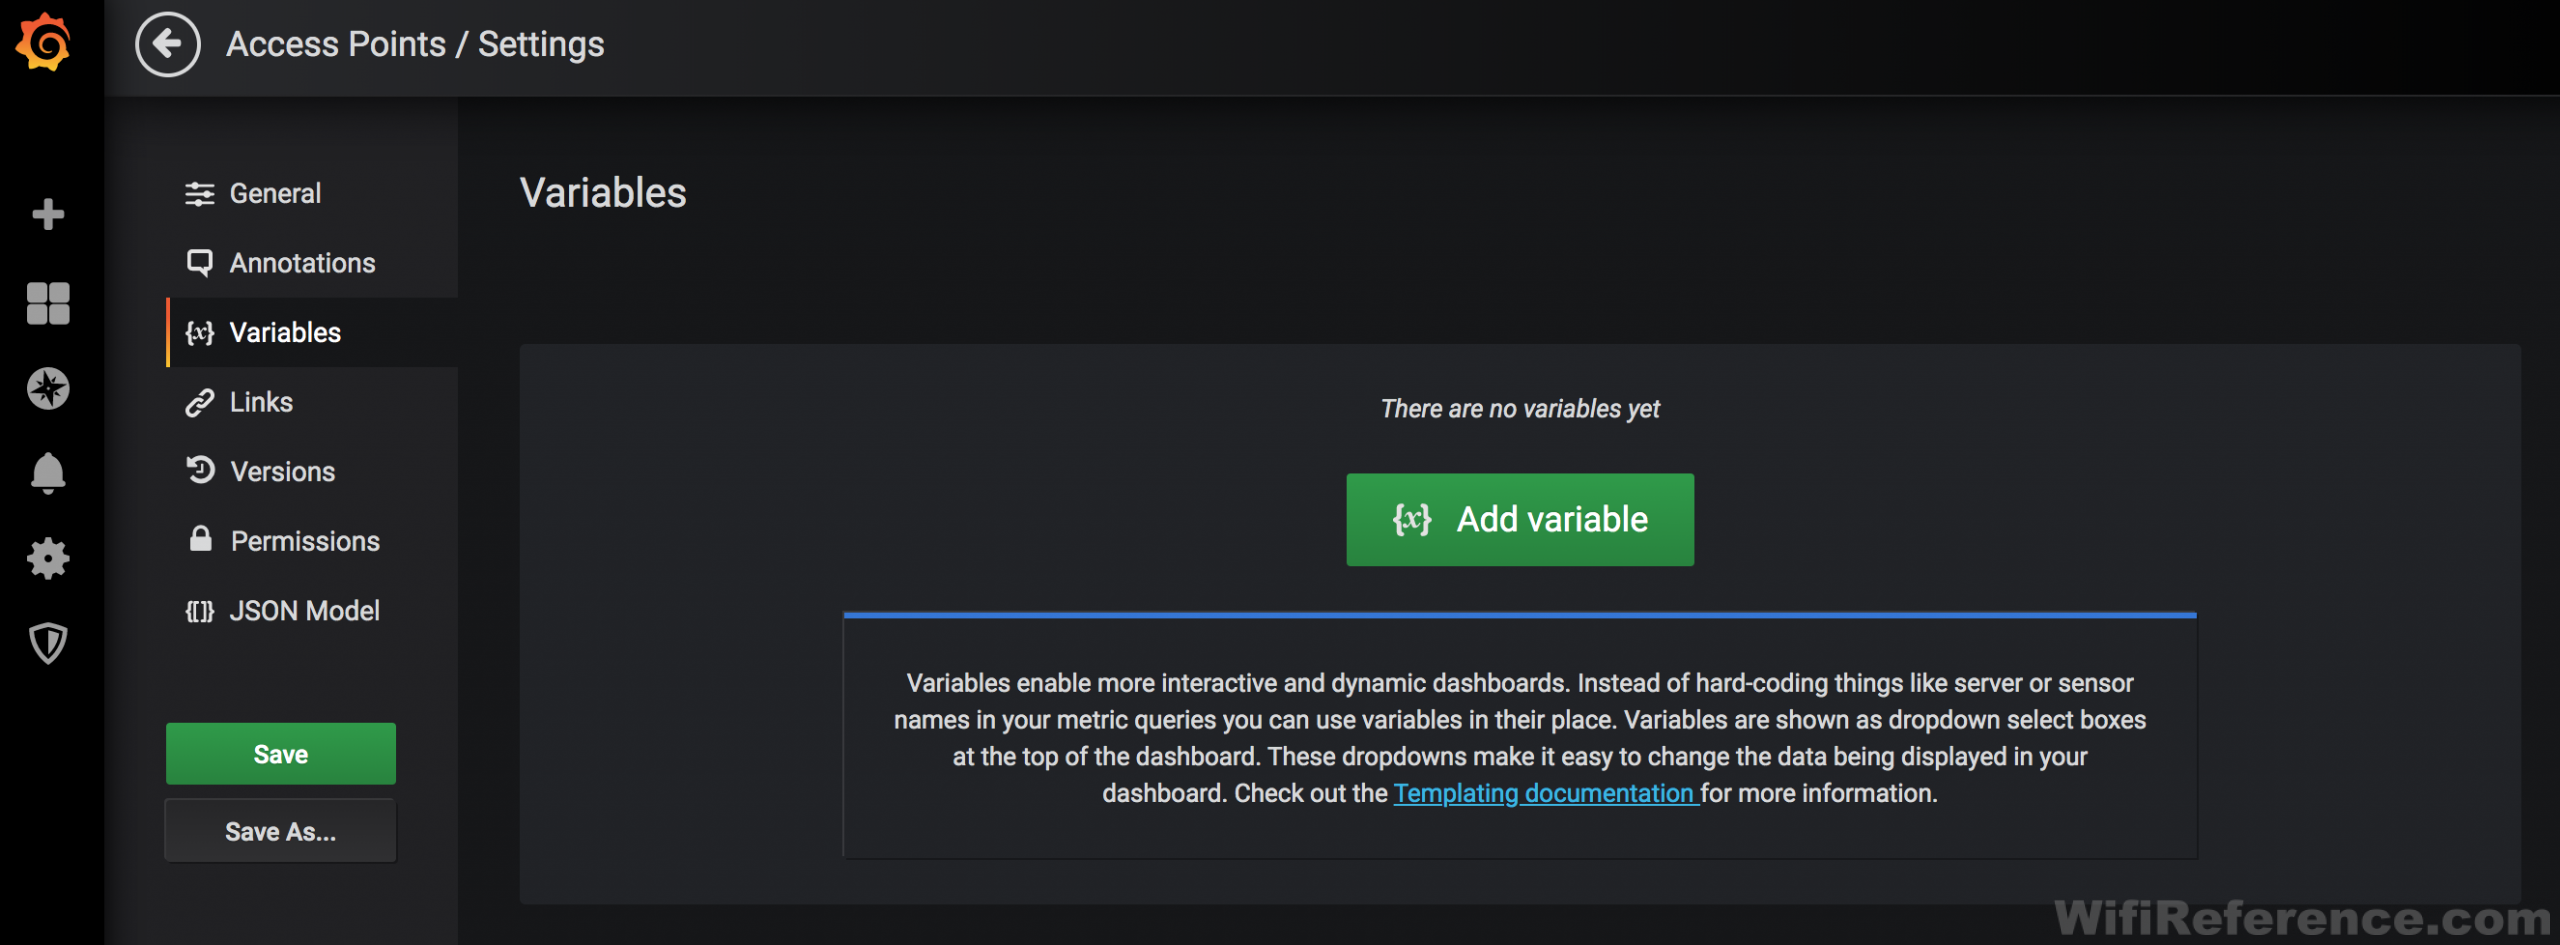
AP MAC Address Variable
We’ll start by creating a variable for AP MAC Address. Click the Add Variable button, and populate the fields as follows:
- General
- Name: APMAC
- Type: Query
- Hide: Variable (optional: the intention being this will get used in the background as selected by AP Name)
- Query Options
- Data source: InfluxDB
- Refresh: On Dashboard Load (it will refresh the list of AP MACs each time the dashboard is loaded)
- Query:
SELECT distinct("wtp_mac") FROM "Cisco-IOS-XE-wireless-access-point-oper:access-point-oper-data/ap-name-mac-map" WHERE ("wtp_name" =~ /^$APName$/)
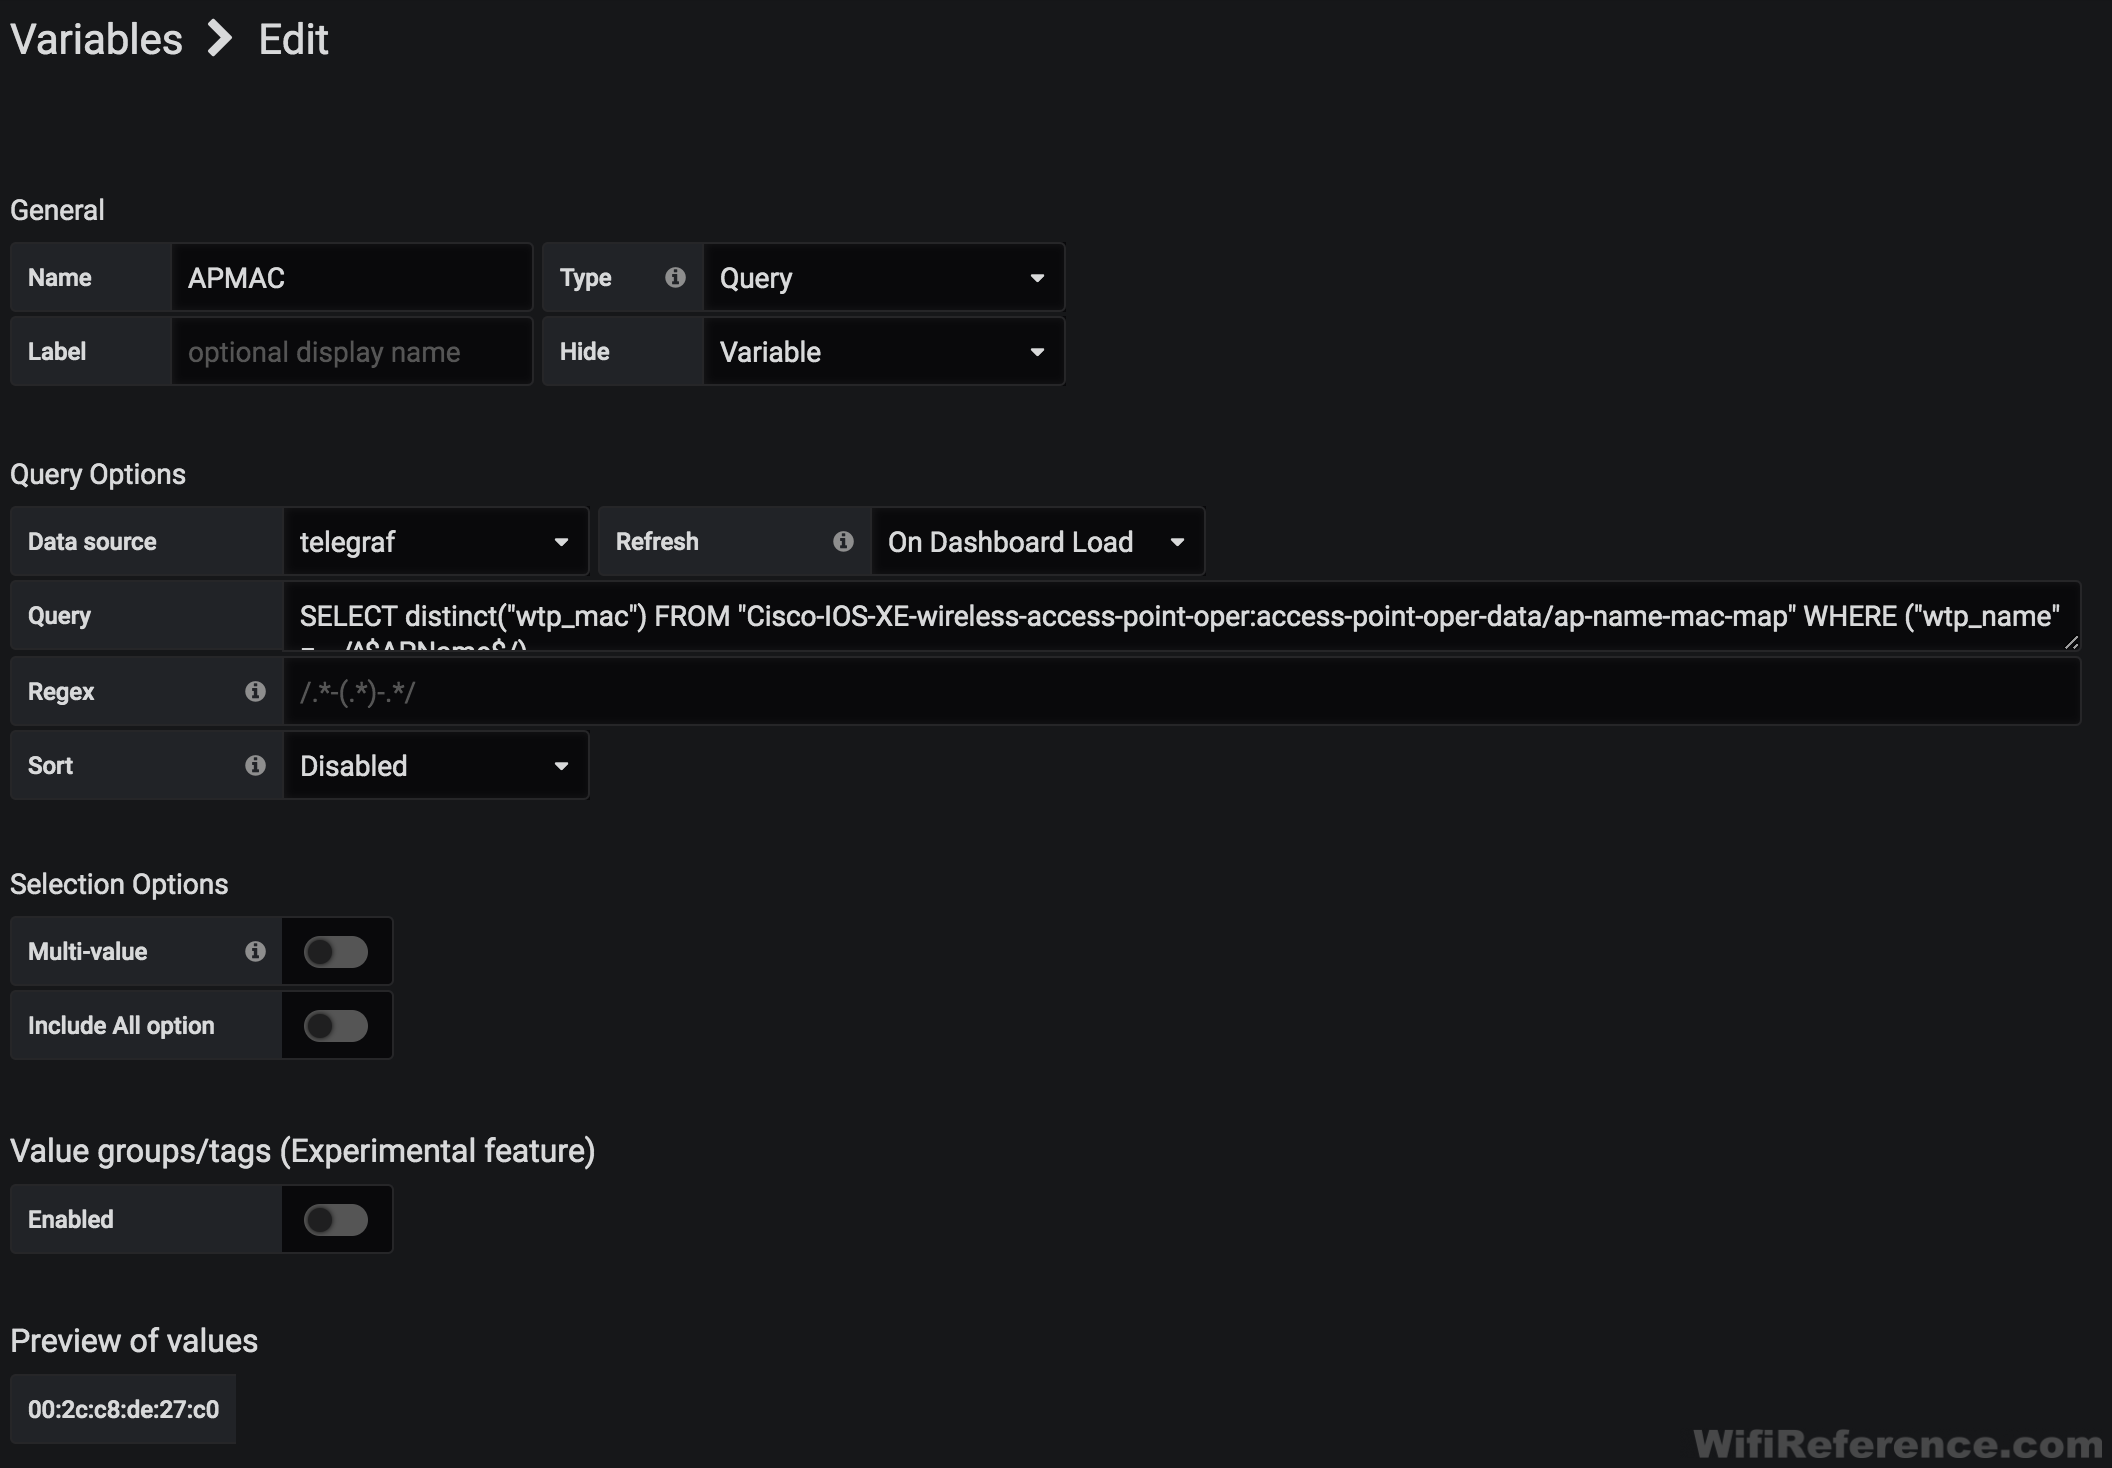
Check the “Preview of values” section at the bottom of the page to ensure that you are seeing some MAC addresses. If you don’t see anything here, there is likely something wrong with the query.
Click Save and create another new variable:
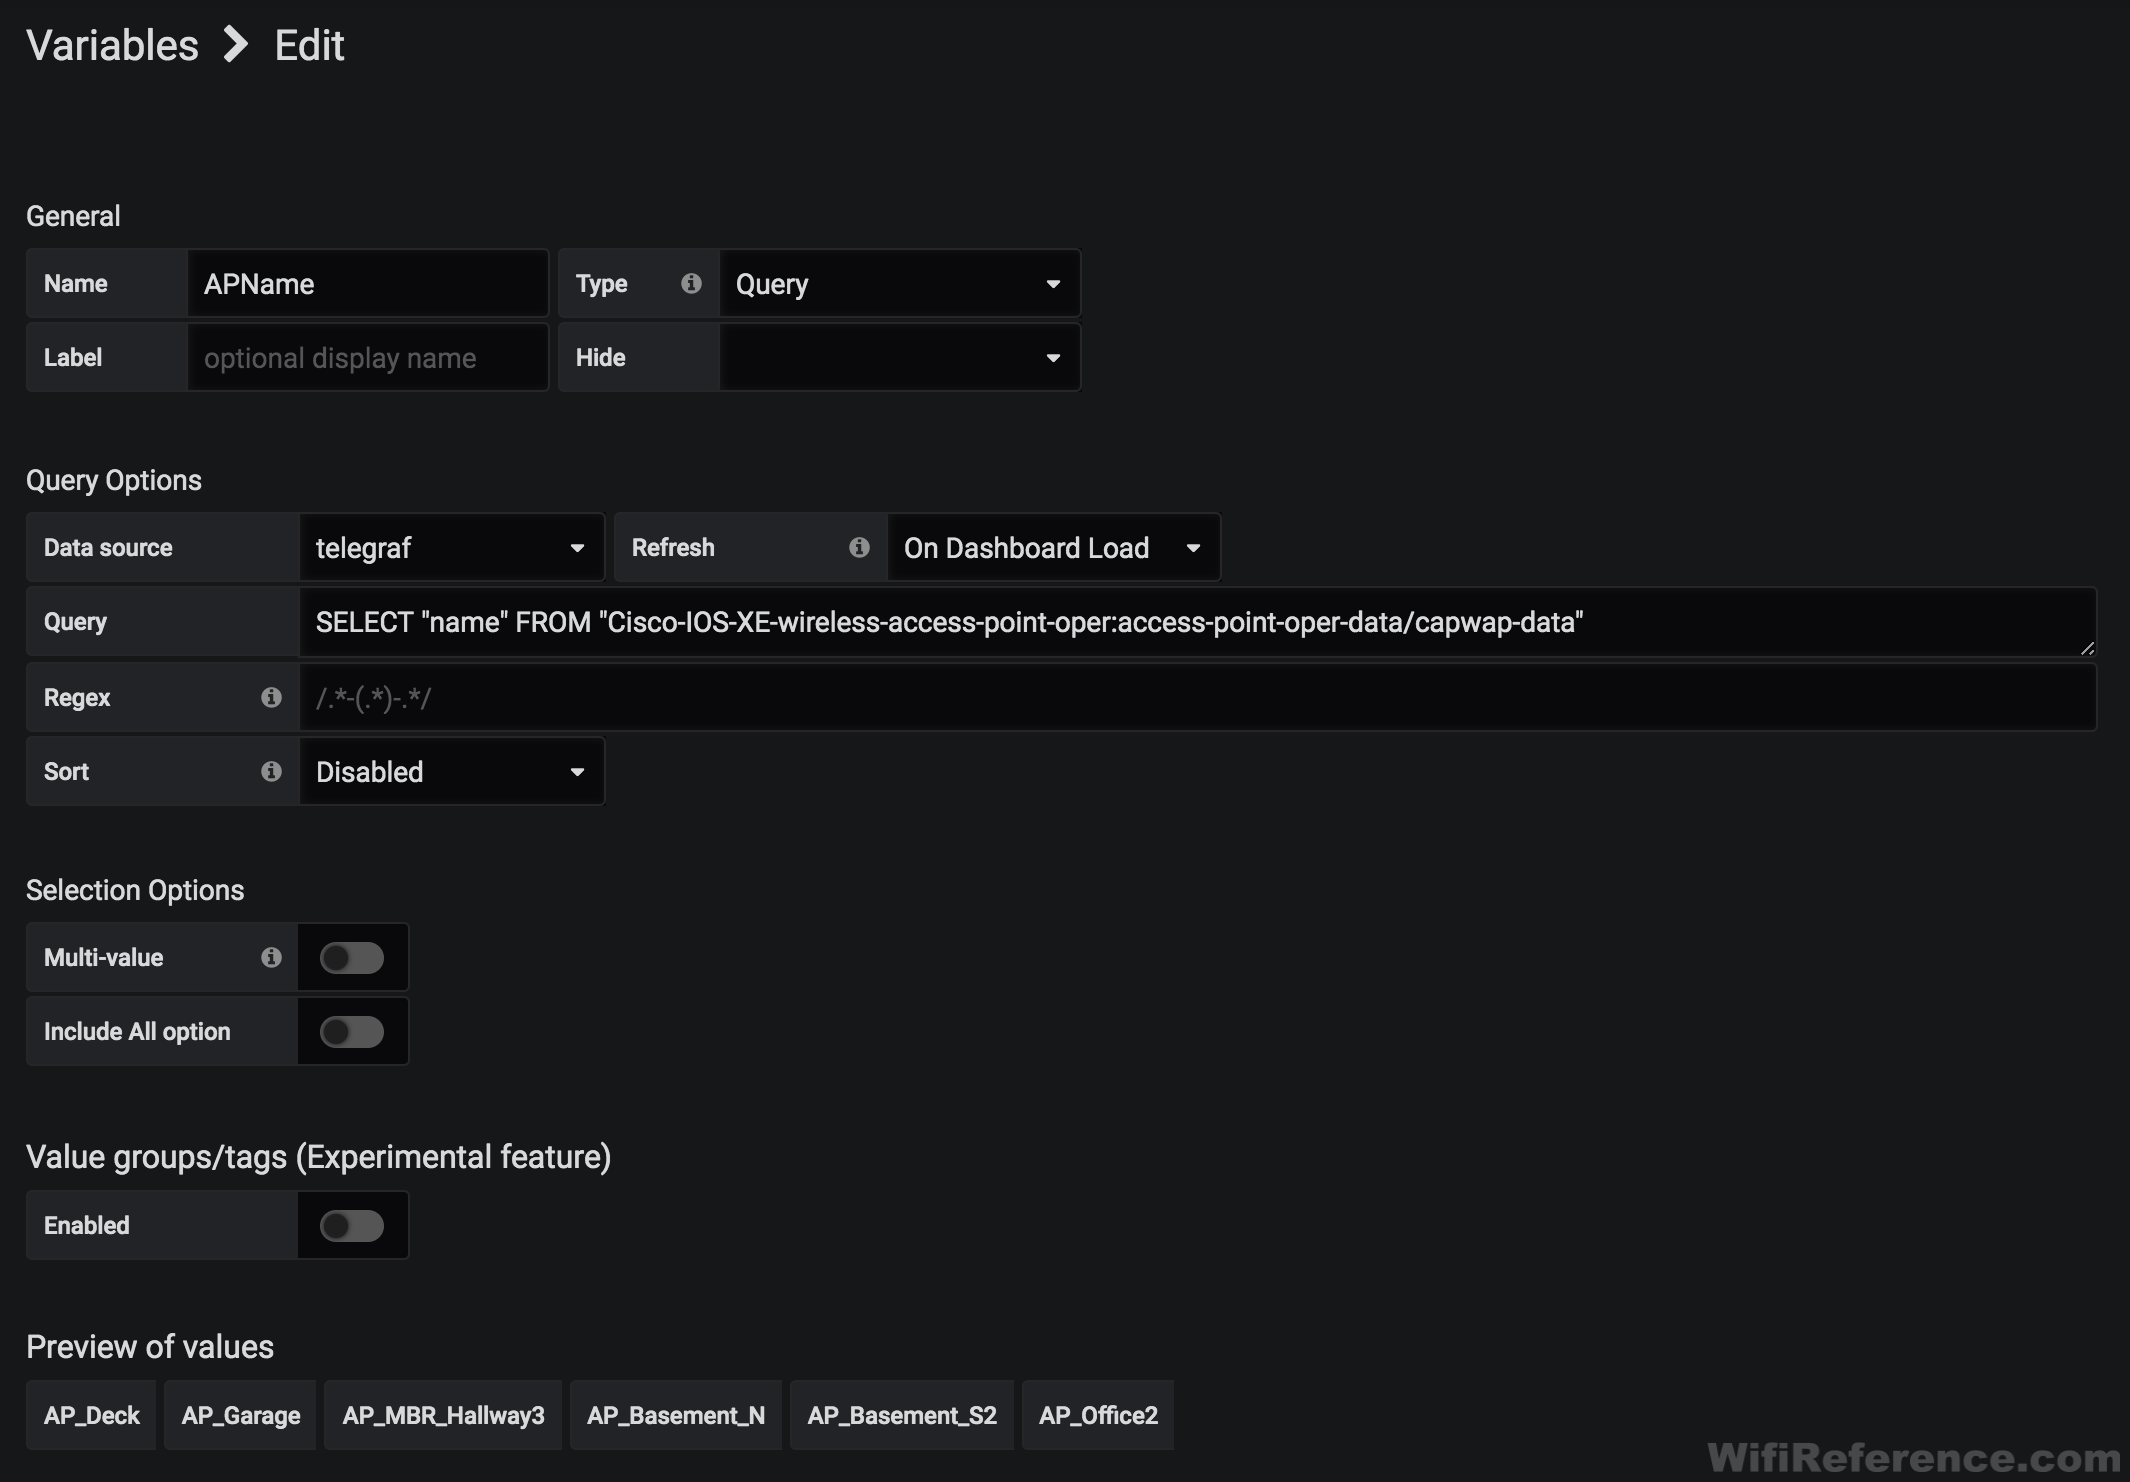
AP Name Variable
- General
- Name: APName
- Type: Query
- Query Options
- Data source: InfluxDB
- Refresh: On Dashboard Load
- Query:
SELECT "name" FROM "Cisco-IOS-XE-wireless-access-point-oper:access-point-oper-data/capwap-data"
Click Save
Go back to your dashboard and you should now see a drop-down at the upper-left corner of the dashboard called “APName.” Note: You will see two drop-down menus if you opted to not hide the APMAC variable. If you pull that drop-down down, you should see a list of all of your AP Names. I’ll now go through the Client variables I use. You should consider placing these on a new dashboard if you plan to have a separate dashboard for client-related information.
Client MAC Variable
- General
- Name: Client
- Type: Query
- Query Options
- Data source: InfluxDB
- Refresh: On Dashboard Load
- Query:
SHOW TAG VALUES WITH KEY = "ms_mac_address"
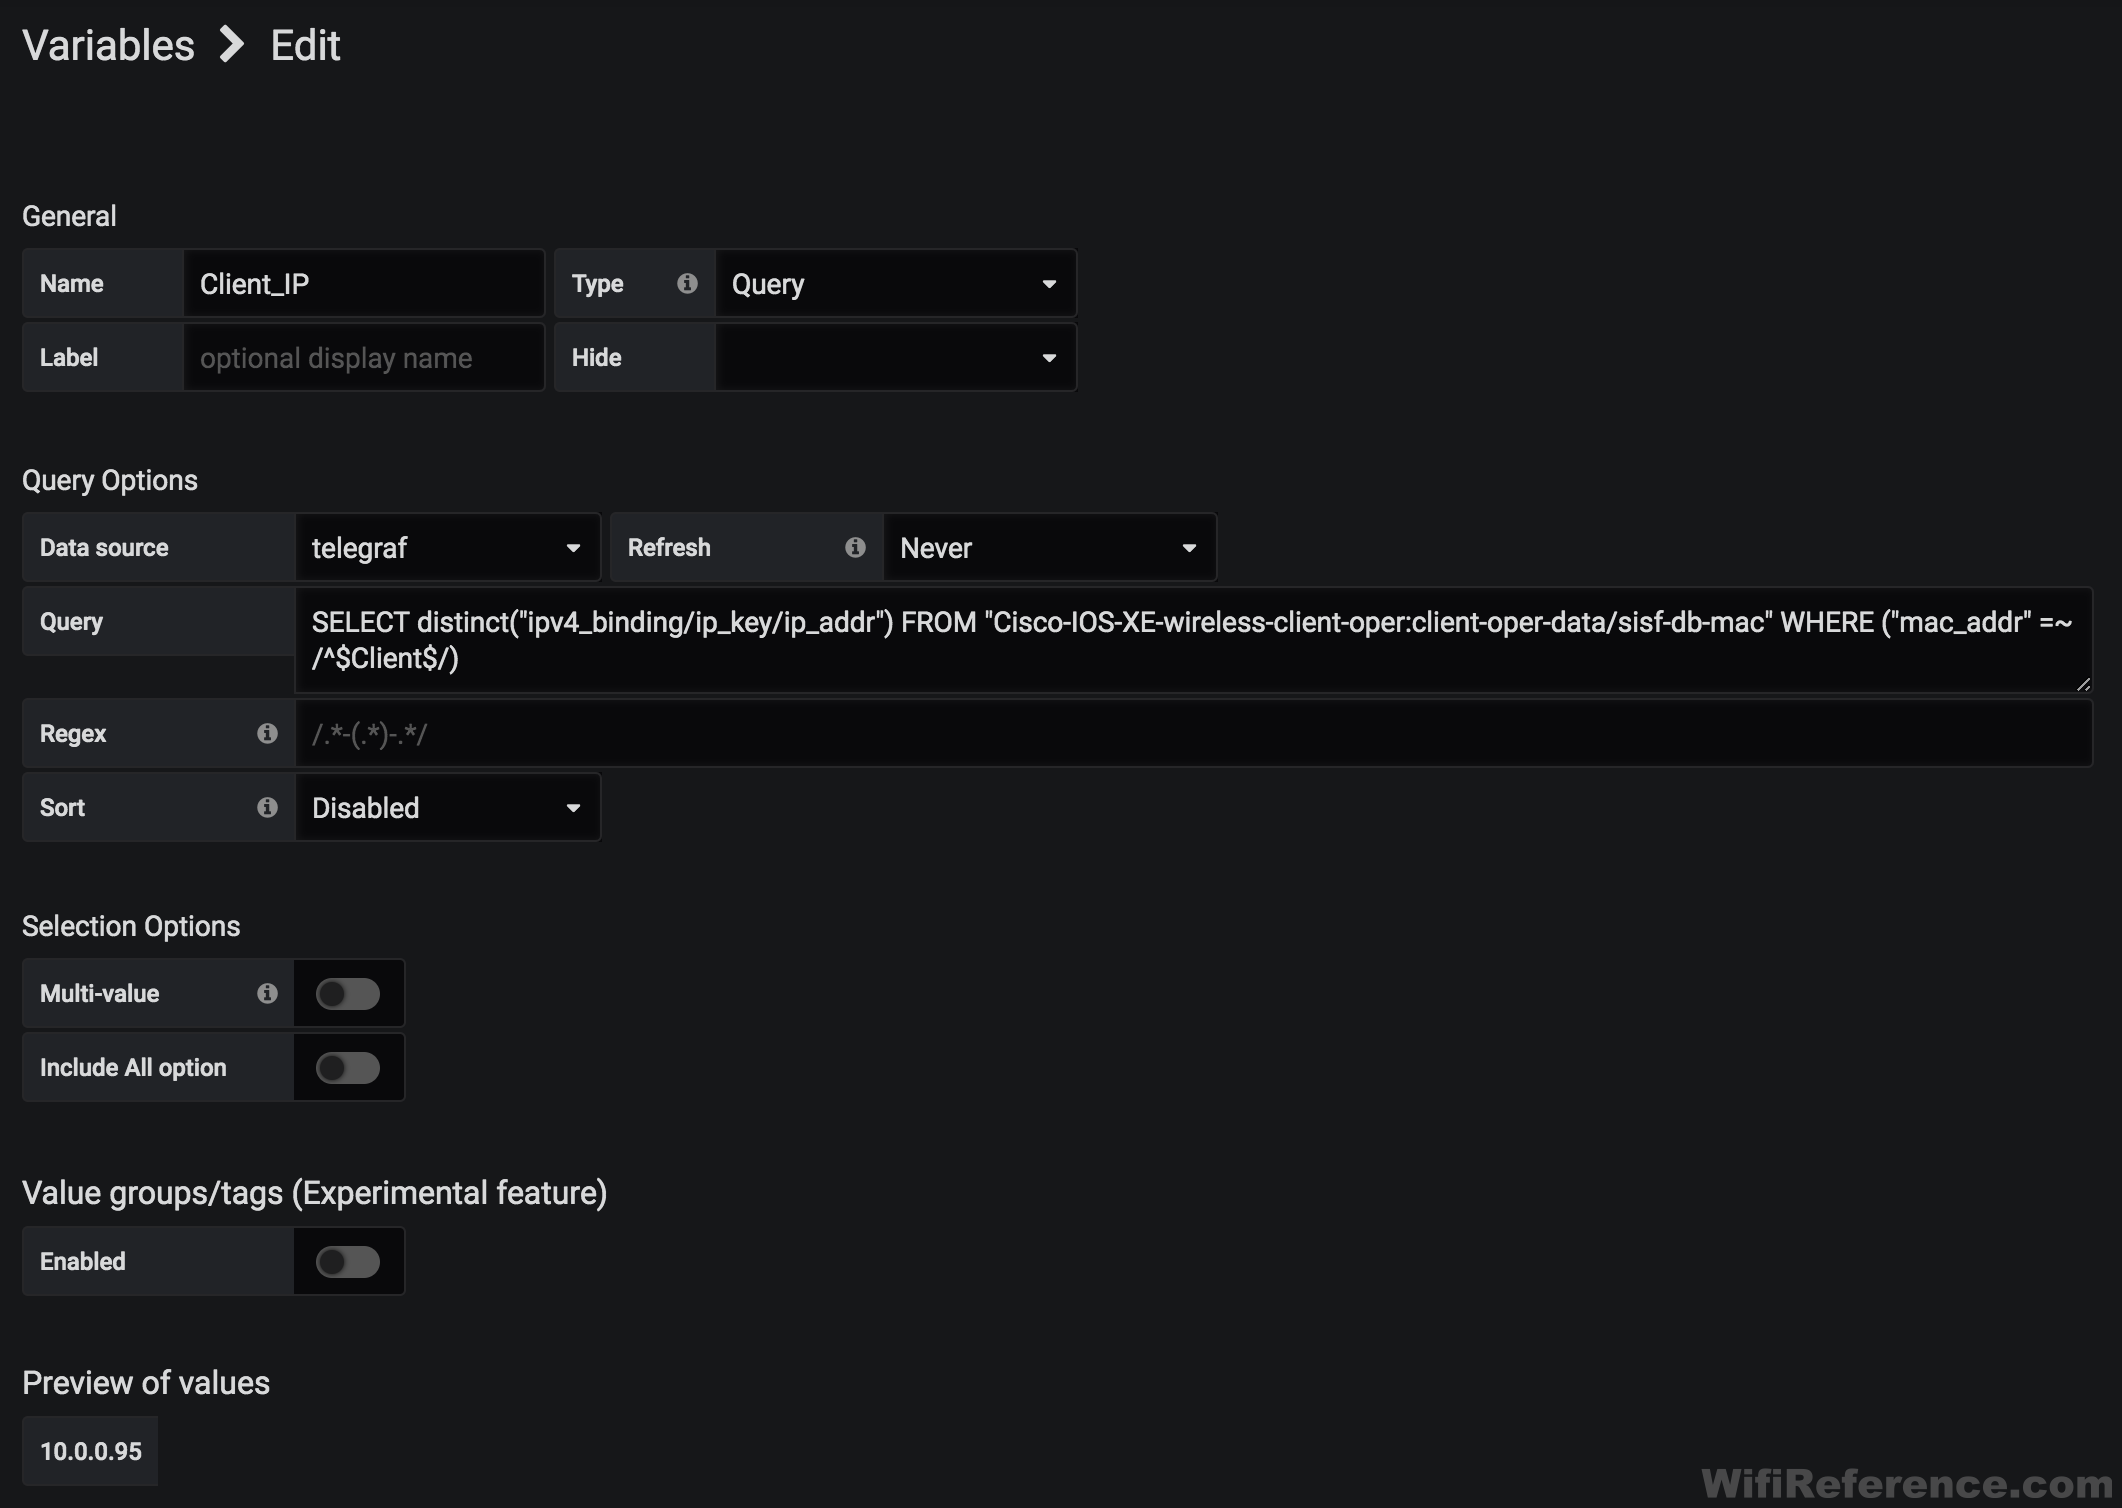
Client IP Variable
- General
- Name: Client_IP
- Type: Query
- Query Options
- Data source: InfluxDB
- Refresh: On Dashboard Load
- Query:
SELECT distinct("ipv4_binding/ip_key/ip_addr") FROM "Cisco-IOS-XE-wireless-client-oper:client-oper-data/sisf-db-mac" WHERE ("mac_addr" =~ /^$Client$/)
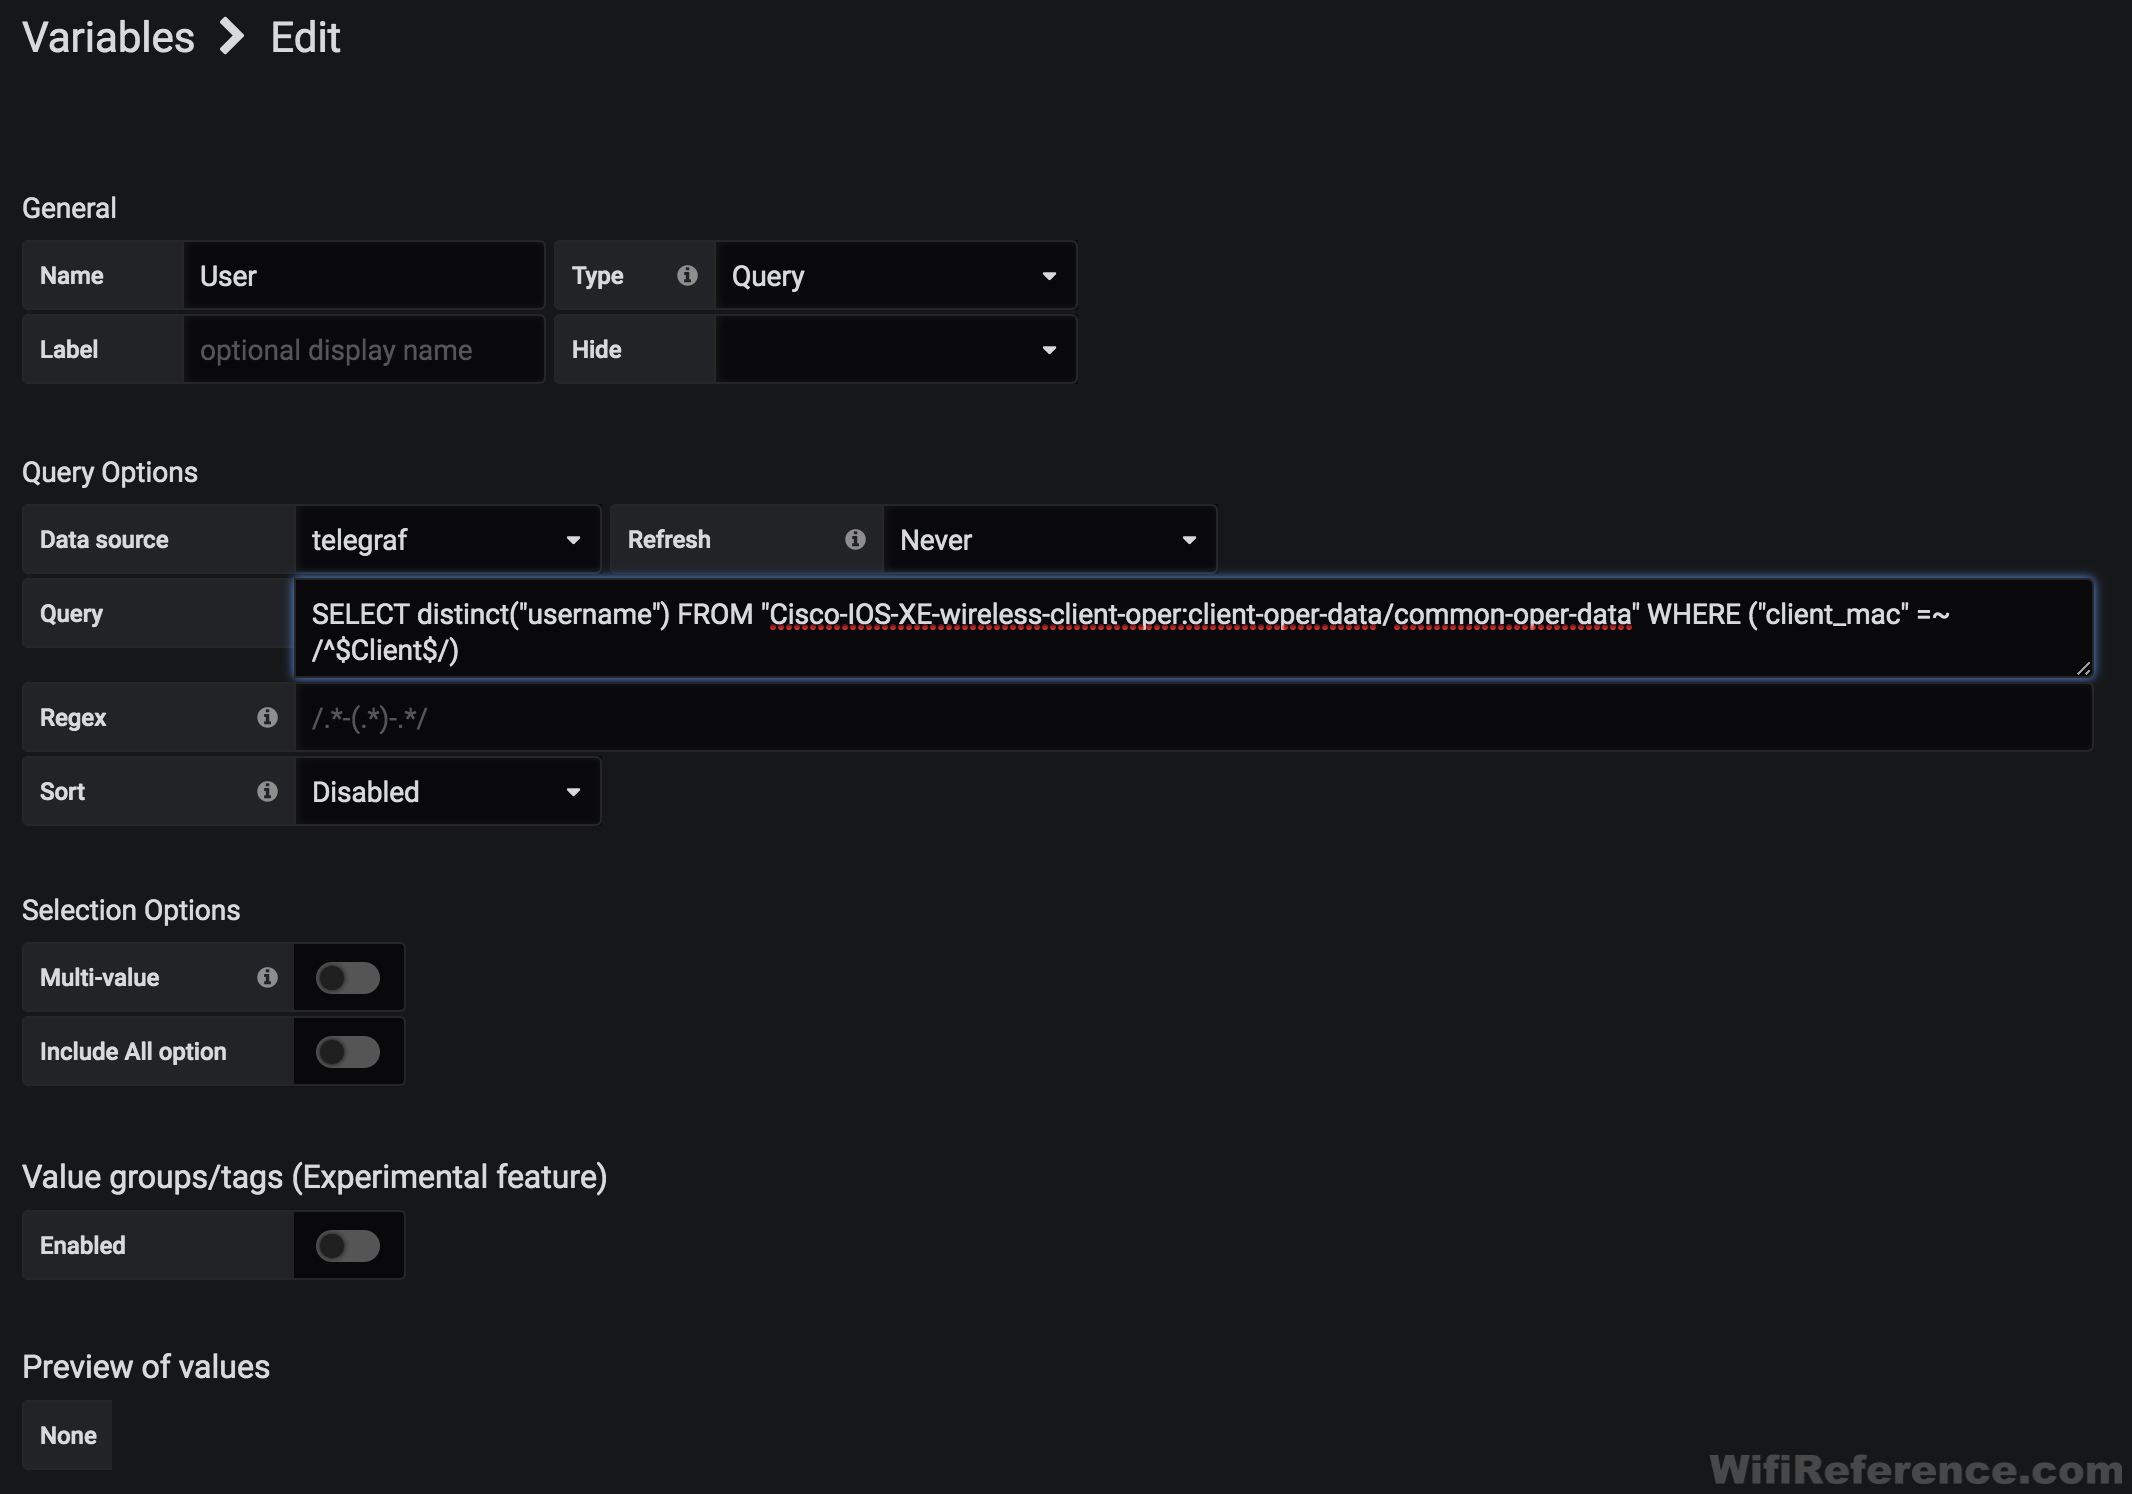
Username Variable
- General
- Name: User
- Type: Query
- Query Options
- Data source: InfluxDB
- Refresh: On Dashboard Load
- Query:
SELECT distinct("username") FROM "Cisco-IOS-XE-wireless-client-oper:client-oper-data/common-oper-data" WHERE ("client_mac" =~ /^$Client$/)
Now we need to build a panel that uses these variables:
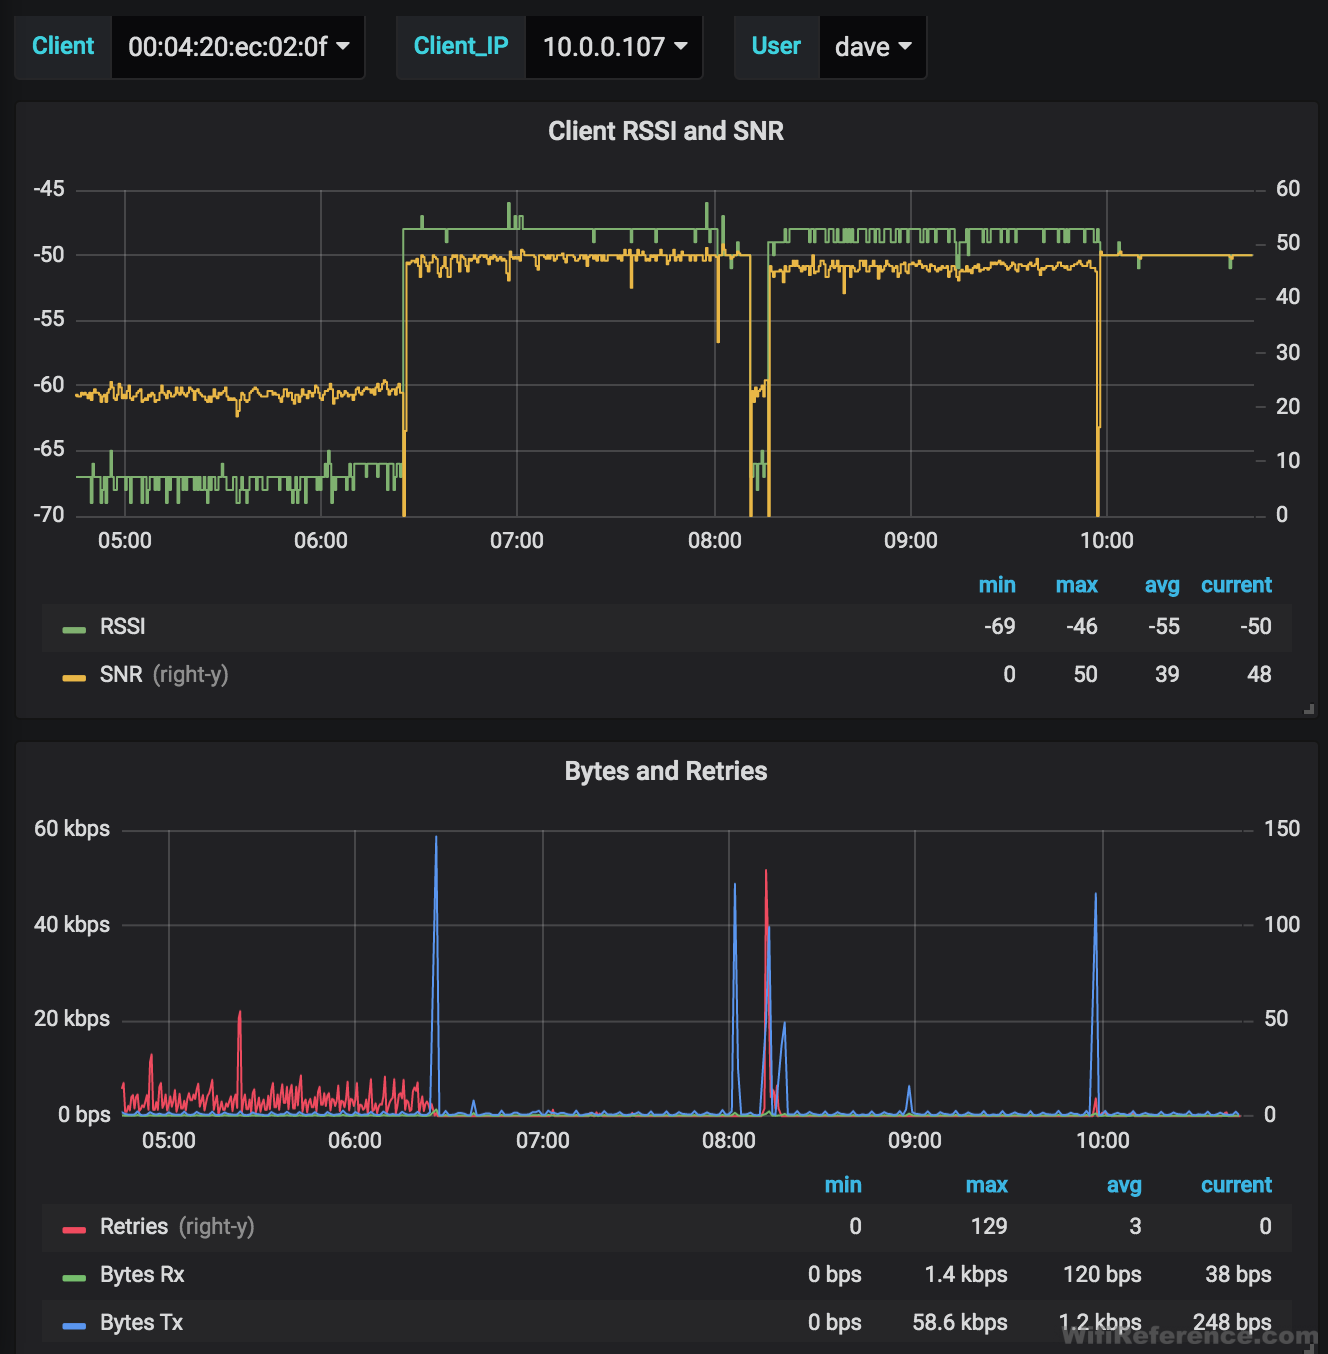
Creating a panel that uses variables
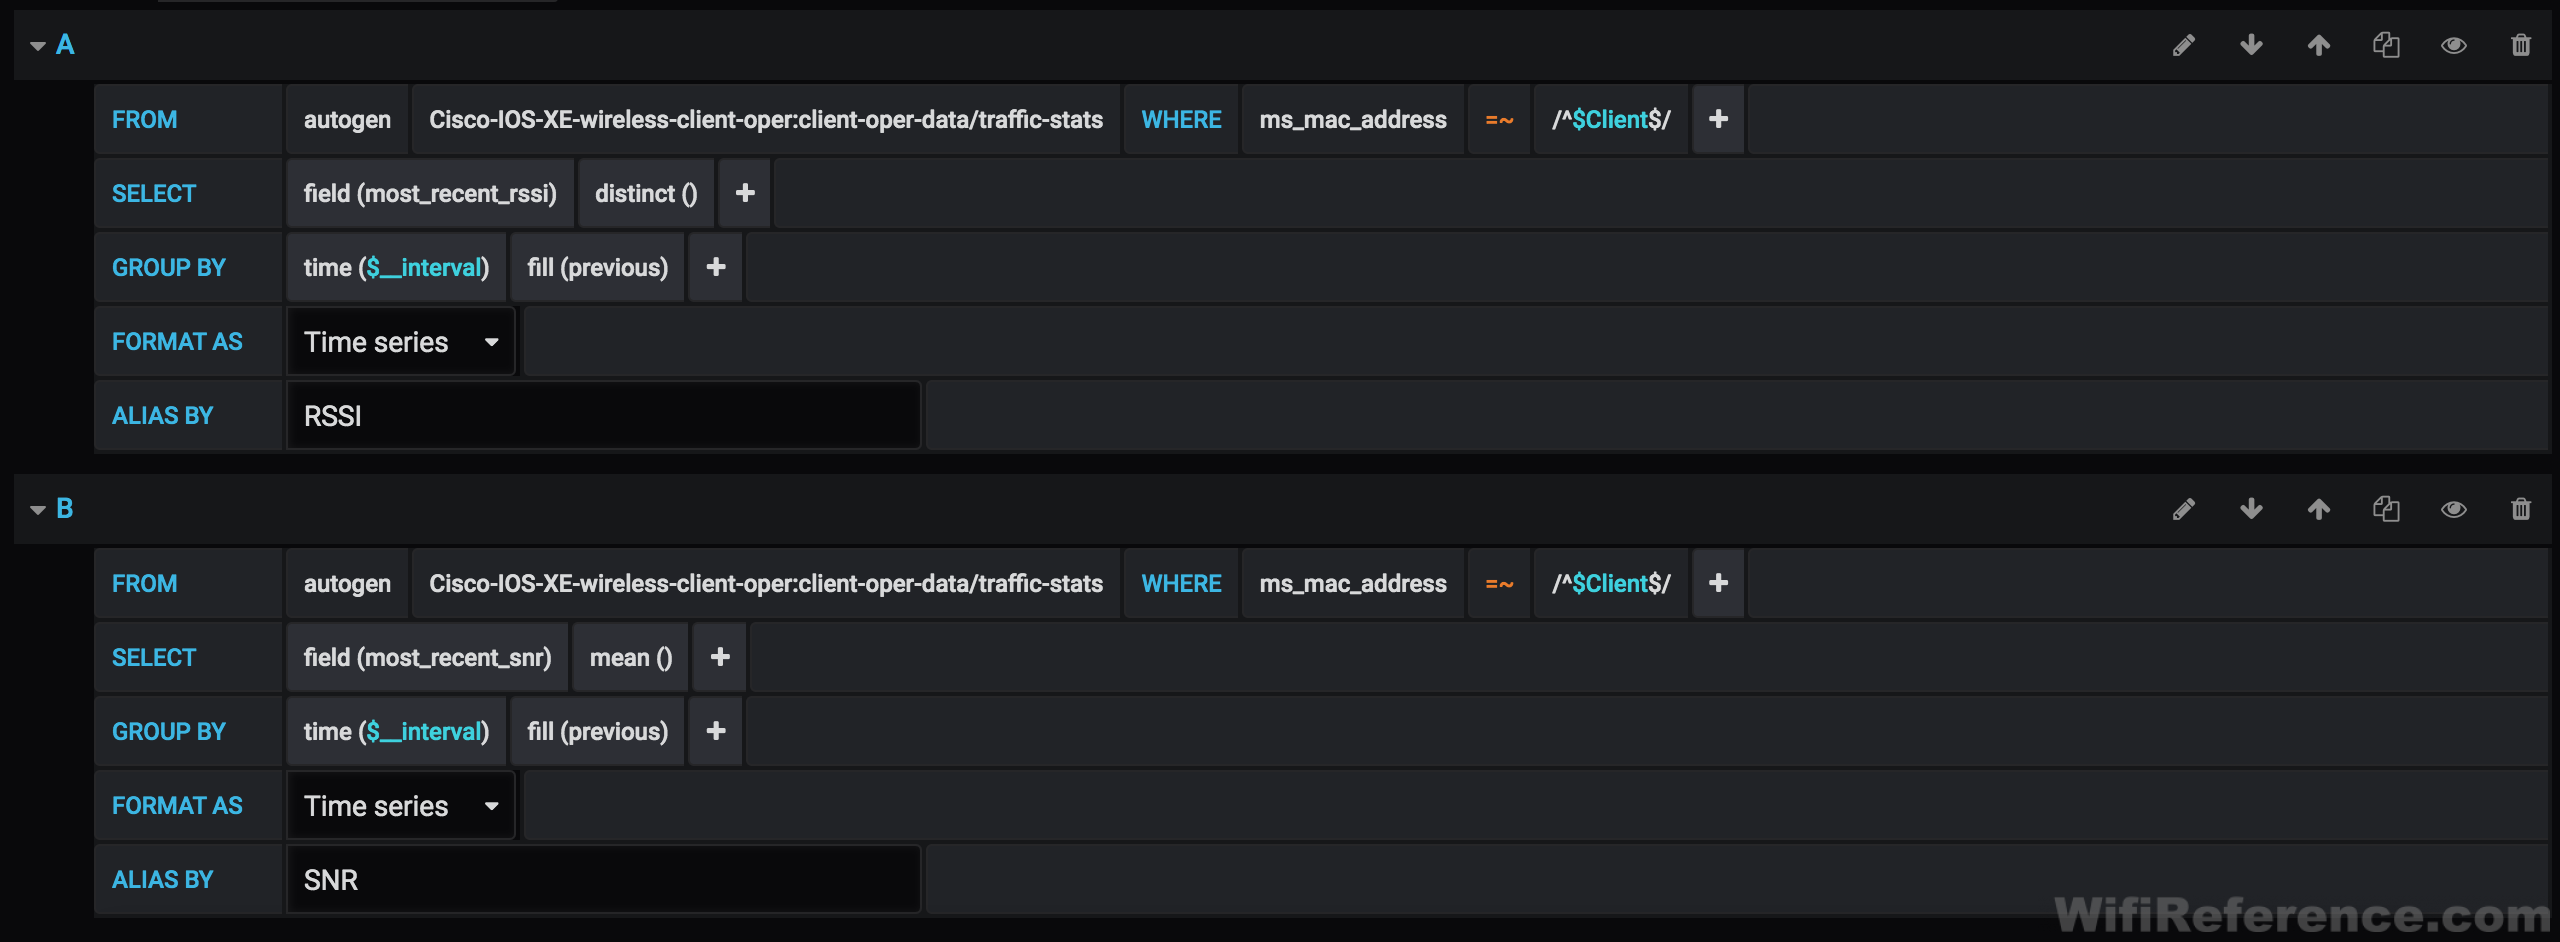
Create another new panel. This one will be for Client RSSI and SNR, using the Client variable we created earlier. Create a new panel:
- Query A
- Select measurement: Cisco-IOS-XE-wireless-client-oper:client-oper-data/traffic-stats
- WHERE ms_mac_address =~ /^$Client$/ (you should see this and your other variables in the dropdown list)
- SELECT field (most_recent_rssi) distinct()
- Alias by: RSSI
- Query B (duplicate Query A and change the following)
- SELECT field(most_recent_snr) distinct()
- Alias by: SNR
It should look like this when complete:
At this point you should be able to pull down the Client menu in the upper-left corner, and choose a client MAC. The graph should react/change with each client MAC address you choose.
Other useful queries to make cool charts
Most of these can be selectable for either 2.4GHz or 5GHz, and can be set to use a variable for the wpc_mac instead of a specific MAC.
TxPower

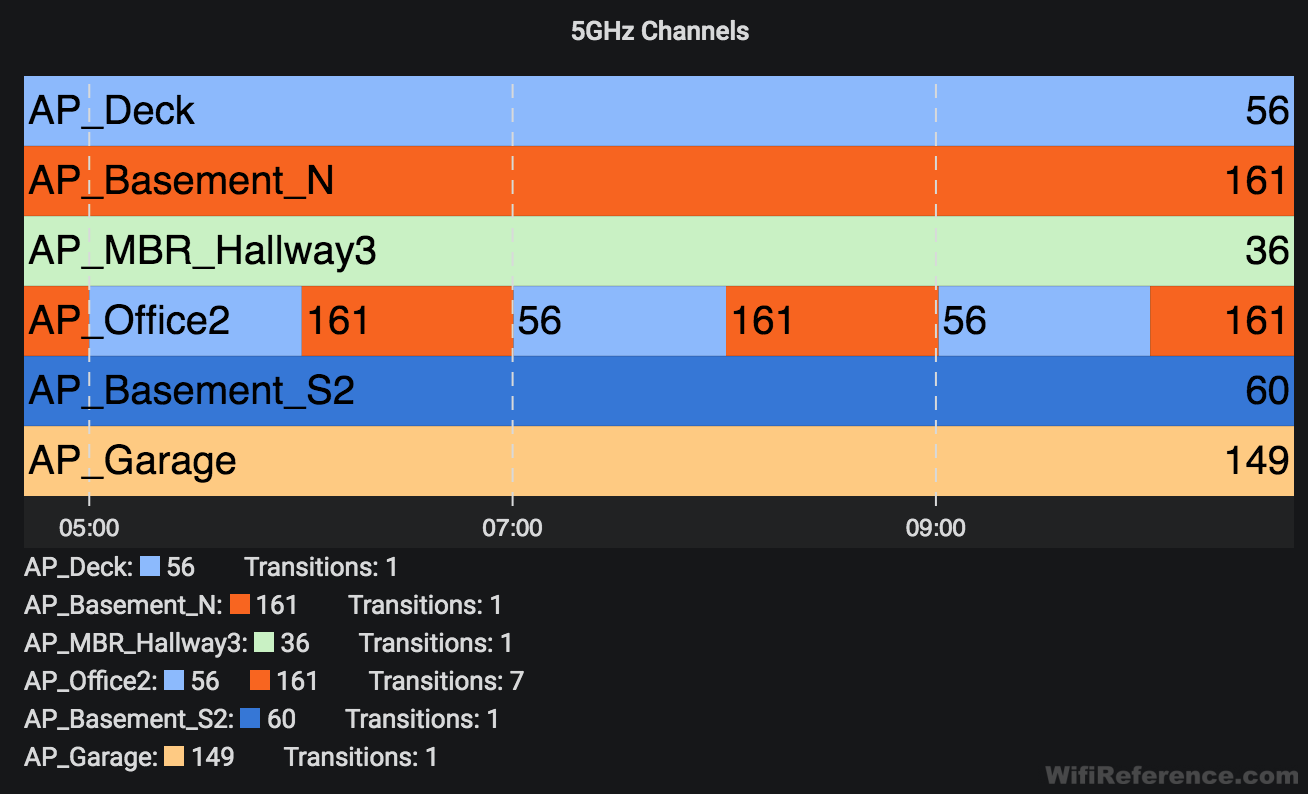
Current channel

Note2: I am using the “Discrete” panel plugin for Grafana to display this data.
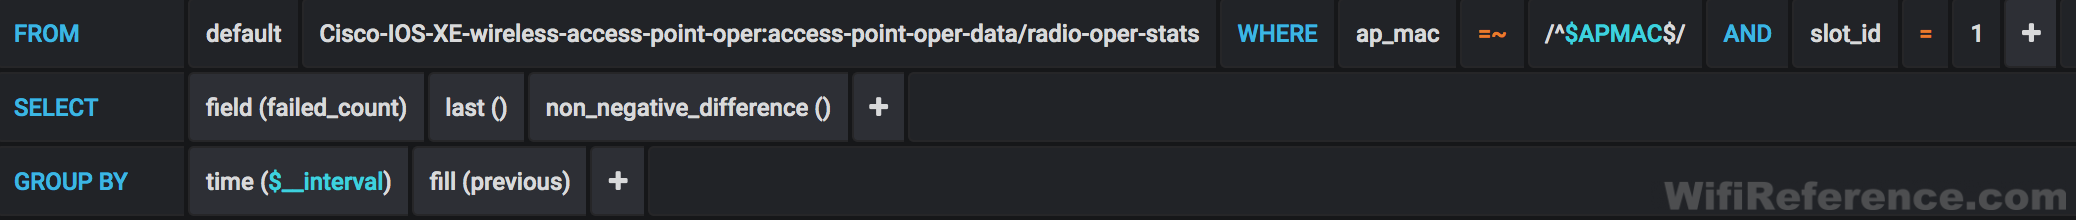
AP Failed Transmits
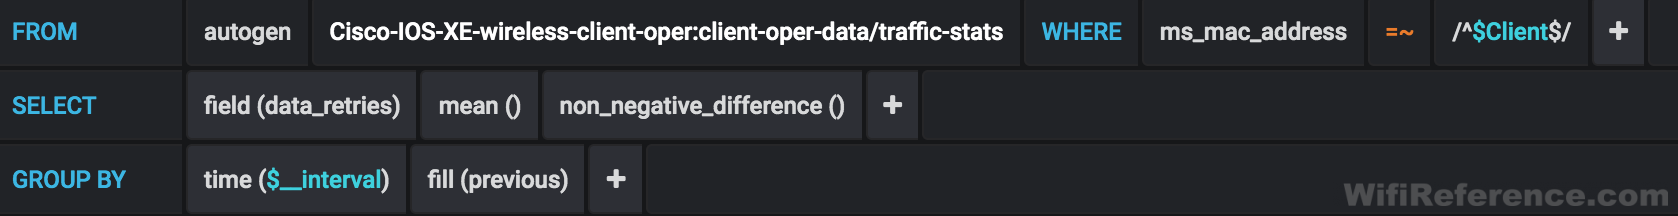
Client Data Retries
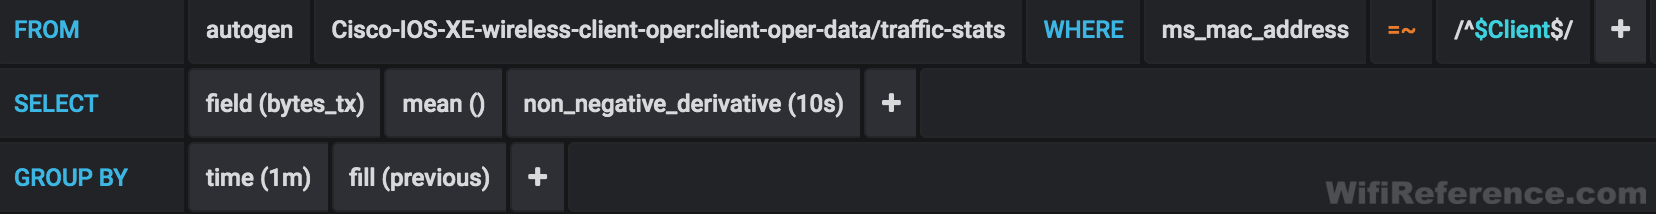
Client Tx Bytes
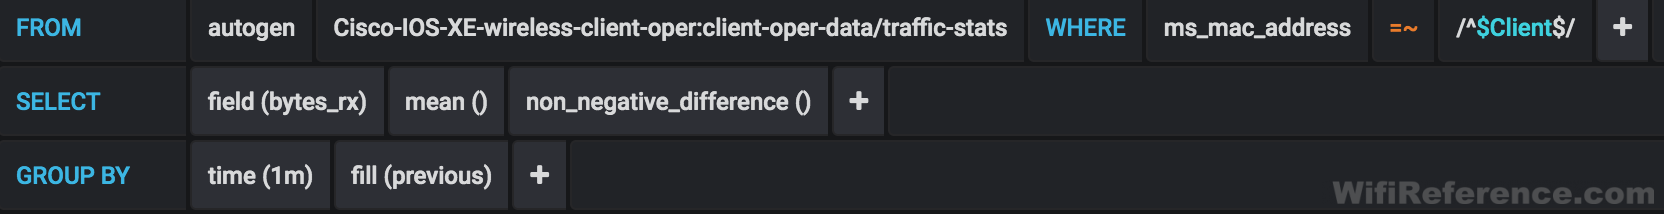
Client Rx Bytes
Total Connected Access Points
You should now have enough information to get your feet wet. Play around with some different queries, change how the charts look, and make some new dashboards. I’d love to see some comments showing some of the interesting data you were able to visualize from your own Catalyst 9800!
Where do you place the yang files?
Nevermind, I figured it out
This is helpful too: https://yangcatalog.org/yang-search
Thanks! That’s a bookmark for sure!
Thank you Dave for this great guide. I’m trying to set this up in our environment, but with Prometheus instead of InfluxDB. I have the Telegraf output plugin configured, but it seems I am not getting all the data. For instance, in Prometheus, I can find the metric “Cisco_IOS_XE_wireless_client_oper:client_oper_data_common_oper_data_wlan_id”, but I cannot find the metric for the “co-state” or “username, which is all under the same container in the YANG model.
Is there something that needs to be adapted to feed the data into Prometheus correctly?
Thanks,
Luke
I have limited experience with Prometheus, so I really can’t answer your question effectively. Could you stand up an instance of InfluxDB on that box as a test, and see if those fields appear? That would help determine whether the issue is on the DB side or if the WLC is not sending the data.
Hi Dave, thanks for your response, I eventually managed to figure out what the problem is. Prometheus apparently ignores string fields, so any field that has a numeric value shows up, but any field that has a string value is simply ignored. I’ve spun up an instance of InfluxDB to test and I see all values there. Thanks.
For anyone else confused, InfluxDB_v2 syntax is completely different than version 1. For example, here is how I queried total AP count.
from(bucket: “telegraf”)
|> range(start: v.timeRangeStart, stop: v.timeRangeStop)
|> filter(fn: (r) => r[“_measurement”] == “Cisco-IOS-XE-wireless-access-point-oper:access-point-oper-data/capwap-data”)
|> filter(fn: (r) => r[“_field”] == “name”)
|> group()
|> aggregateWindow(
every: 1m,
fn: (column, tables= tables |> distinct() |> count()
)
It’s important to understand that each pipe forward operator is taking the result from the previous function and creating a new table. This makes the order that your write the query very important.
Lastly, although I have not tested it yet, Cisco has released Yang Suite which is a tool for exploring YANG models and generating telemetry configs on the fly.
Thanks for the updated information!
Great guide! Just a small correction that the 9800 outputs telemetry in centiseconds rather than milliseconds so in your configuration it would be exporting the data every 10 seconds rather than every 1 second as described in the guide. To do each second the configuration would be “update-policy periodic 100”.
Has anyone scaled this out for multiple 9800’s? If so, how big and have you run into any resource constraints?
Hello,
Thanks for your precious post
I have a question for the XPath: /wireless-access-point-oper:access-point-oper-data/ssid-counters
This Xpath is configured on the Cisco 9800 but I don’t found this measurement on my influxdb database
Someone have an idea ?
Thanks
Great post 🙂
I used it to visualize the MTU of the AP.
Hi,
I have same issue with you. I cannot get any xpath that I’ve configured on 9800 WLC on my influxdb database. It is just showing cpu, disk, diskio, etc but not all xpath configured. Any idea about this?
Check your telegraf configuration. Telegraf is responsible for listening to the gRPC channel and sending the information to InfluxDB.
Impressive work, maybe there is a place where I can download the resulting dashboard in grafana?
It’s difficult to build these graphs in a way that they are flexible enough to work in all different types of environments. I did not upload the dashboard json because I was trying to show how to arrive at each type of graph so that folks could build graphs specific to their own environment. If you’re interested in the json for a specific graph, let me know and I can send it.
great guide. still works in 2024 although there are slight changes in the UI and such. Much appreciated as this was the only guide that helped me get reportable data from my switches. I am running eWLC so i will try to see if i can get anything out if it
Can you export the grafana dashboards?
Telemetry subscription detail:
Subscription ID: 215
Type: Configured
State: Valid
Stream: yang-push
Filter:
Filter type: xpath
XPath: /wireless-access-point-oper:access-point-oper-data/ssid-counters
Update policy:
Update Trigger: periodic
Period: 3000
Encoding: encode-kvgpb
Source VRF:
Source Address: 10.200.200.36
Notes: Subscription validated
Named Receivers:
Name Last State Change State Explanation
——————————————————————————————————————————————————-
grpc-tcp://10.200.64.102:57000 06/06/24 18:10:39 Connected
Hi Team,
For the above XPath details, I am unable to find any subscriptions for the number of clients connected to a particular SSID.
I’ll be using Grafana to trigger alerts on APs that dropped off the WLC.