
Introduction to Wireless Assurance with Cisco DNA Center
If you haven’t worked with Cisco DNA Center before, you may be wondering about its capabilities when it comes to wireless networks and wireless clients. Cisco is still at the early stages of integrating wireless features into DNA Center, but some of the work they have done thus far is quite impressive. I’m going to outline my experience with Cisco DNA Center for Wireless Assurance. This article is based on DNA Center v1.2.2, which is the most recent version at the time this was written. Wireless Assurance features are currently being actively developed. Many of the features and configurations are works in progress, and will improve with time. But if you’re like me, you want to see what a product is capable of as soon as it is released. Even if that means you have to deal with some issues along the way. I have been fortunate enough to have access to a DNA Center Appliance, and I wanted to share my experience with the product. I am not (yet) going to go into detail on many of the more Infrastructure-focused facets of DNA Center. For instance, I won’t be focusing on Software Defined Access (SDA) in this article. I will, however, be focusing on what I think are the exciting and useful features for DNA Center as it applies to a Wireless Network.
Topics
- Overview
- Telemetry
- Network and Client Health
- Healthy client statistics
- Unhealthy client statistics and troubleshooting
- Application Health
- Sensor-based tests
- Issues with setup and integration
Overview, Configuration and System Updates
Initial Configuration and Inventory
The first thing you will do when you take the DNAC appliance out of the box is connect a monitor and keyboard to it, and walk through the setup/install wizard. Most of this is pretty self explanatory so I won’t go through it in detail. However, I will mention one thing that was confusing for me. DNAC has 4 physical NICs, and it is not readily apparent that you are configuring the right one(s). My recommendation here is to connect the interfaces one at a time, and look at the status on the screen. During the initial config wizard you will be walked through the configuration of 4 NICs, simply labeled 1-4. If a network link is not detected for the interface you are configuring, you will see a “not connected” message in the upper-left quadrant of the screen. If a link is connected you simply will not see this message (there is no “connected” message). Use the Next/Back buttons to cycle through the 4 interfaces until you have found the one that isn’t complaining about the lack of a connection, and you know you are on the right interface. If you need to configure multiple interfaces, simply just plug them in one at a time. Your config is retained as you Next/Back through the config pages of the 4 NICs. In my case, “NIC 1” on the back of the appliance was actually “NIC 2” in the config wizard. I should also mention that my initial configuration was done with DNAC 1.1.7, so this behavior may be different in earlier/later versions of the software.
System Updates
I’m covering this near the beginning, because it is likely one of the first experiences you will have with DNA Center. You may have some experience with Cisco Prime Infrastructure, and how it was capable of downloading software updates and installing them within the GUI. It wasn’t a perfect process, and required manual intervention to start the download and install the update. DNA Center will download updates on its own, as long as you configure CCO credentials during the initial installation wizard. These updates can be quite large, and may be phased (it may upgrade to an interim release before upgrading to the latest release). This process can take quite a bit of time, and unfortunately there is not sufficient indication in the UI as to what it is doing. You’ll see little more than “downloading” or “installing” next to each application. It may appear to be stuck in one of those states for a long time (hours), and it’s difficult to tell if it is actually stuck, or just taking a long time to complete a task (but still progressing). The advice I was given, and the advice I can give to you is to simply be patient. Very patient. I don’t excel at being patient, so this was very difficult for me. During a software upgrade, it may be necessary to let it sit for 3+ hours (I recommend overnight) for it to complete. If you try to rush it, you may experience all kinds of weirdness in the GUI. I saw half-drawn pages, blank menus and other various failures. Just let it sit. For a long time. Like overnight. I sincerely hope there are better software upgrade progress indicators as DNAC matures.
Inventory
Once the appliance is finished with its install/upgrade gyrations, you will be able to access the GUI.
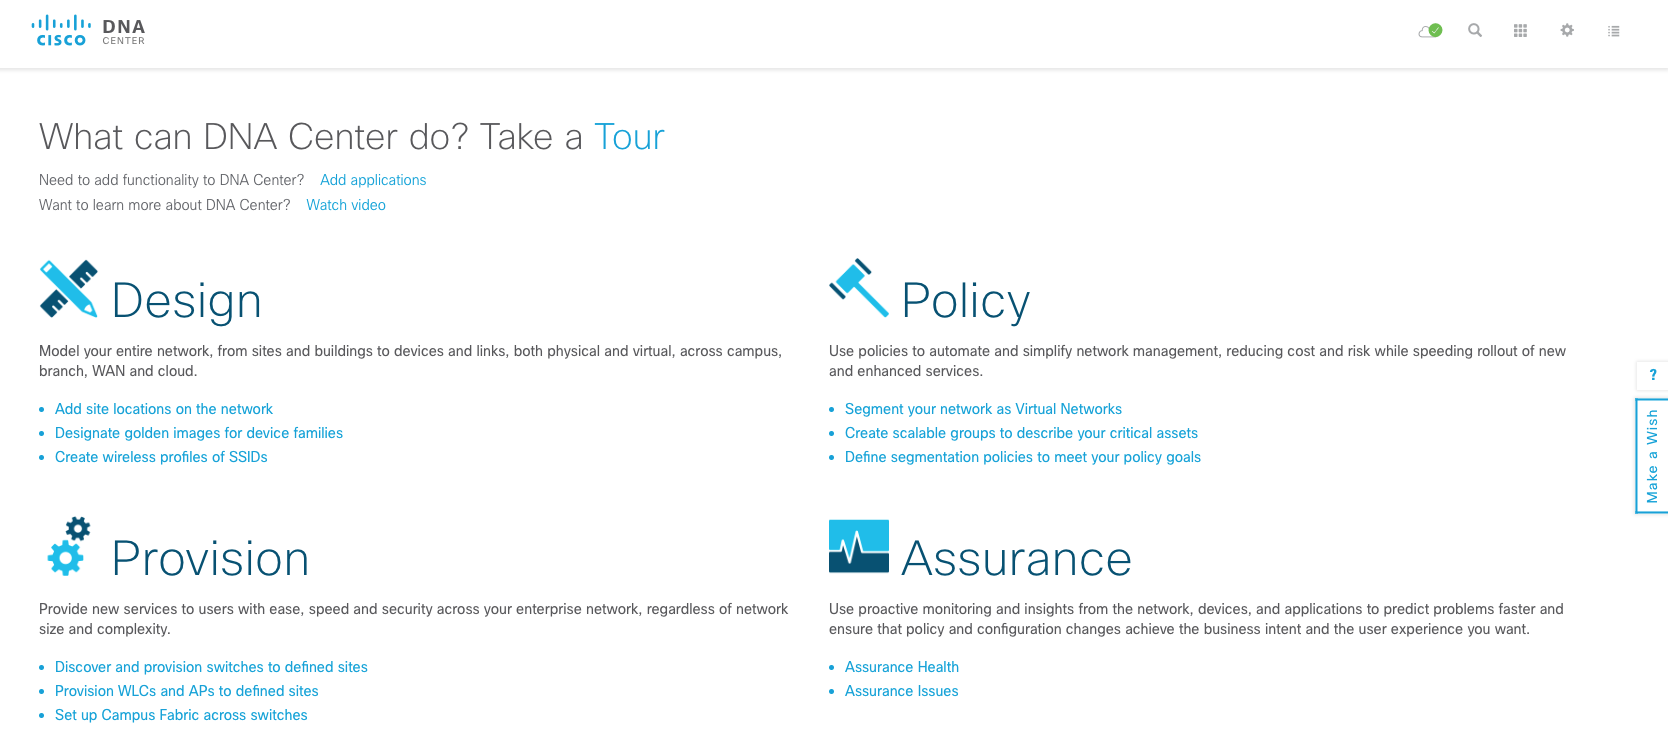
The main dashboard of DNA Center still feels a bit foreign to me. There are 4 clear categories listed, with some helpful subcategories below each. Perhaps it’s because I am focusing specifically on the Assurance functionality, but some of these categories don’t seem that intuitive to me.
- Design – This is where you add your sites, buildings and floors. Basically your Maps from Prime Infrastructure. It is also where you designate your “golden” software images and create SSID profiles that can be provisioned to sites.
- Policy – Here you can create your Network Policies (ACLs) and Application Policies (QoS). This is probably the least-used tab for the Wireless features.
- Provision – This section allows you to assign your devices to Sites, and and provision configuration associated with that site to the device.
- Assurance – This is the main section of focus here, as it contains most of the exciting features related to Wireless Networks and Clients. You will see the Client Health and Network Health for your environment, and you can dig in to network, client and application health statistics.
One of the first things you will want to do is add at least one device to DNA Center, so it can be managed. There are a few ways to add your devices to DNA Center.
- You can add a device individually (I recommend starting with this method)
- You can run a Discovery, to add all of your devices at once
- You can import a CSV. The template can be downloaded from the “Import” button pop-up, in the inventory tools menu.
I’ll cover the first two methods here.
Manually Add a Device Through the Inventory Tool
To do this, you’ll want to access the Inventory module. There are two ways to access the Inventory module.
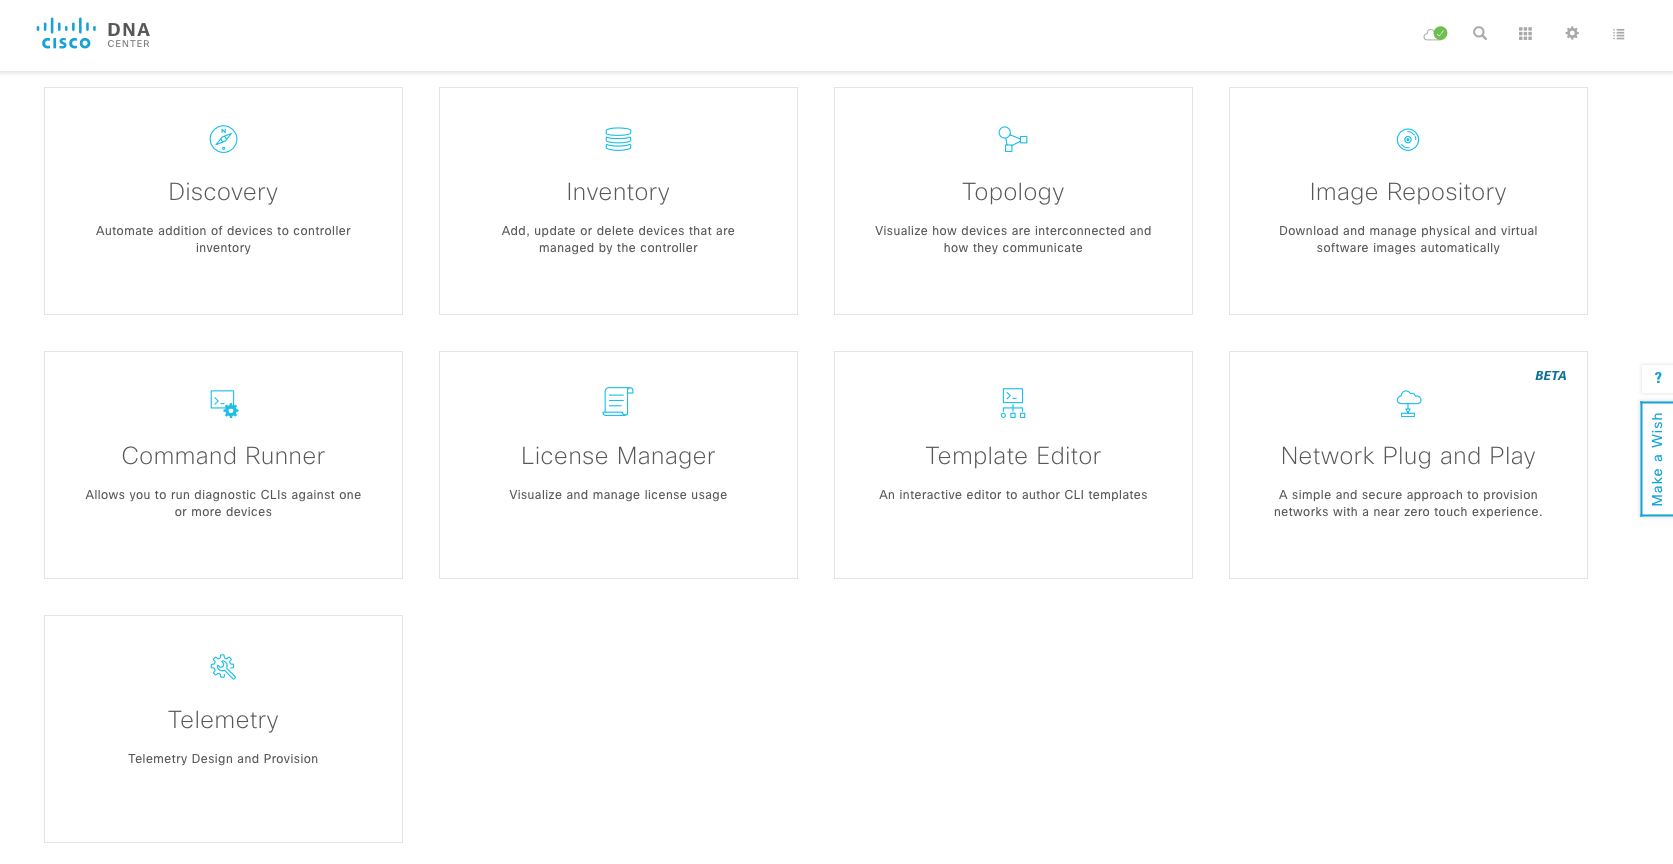
- Scroll down on the main page to see the large tiles that explain each of the Tools. Click Inventory
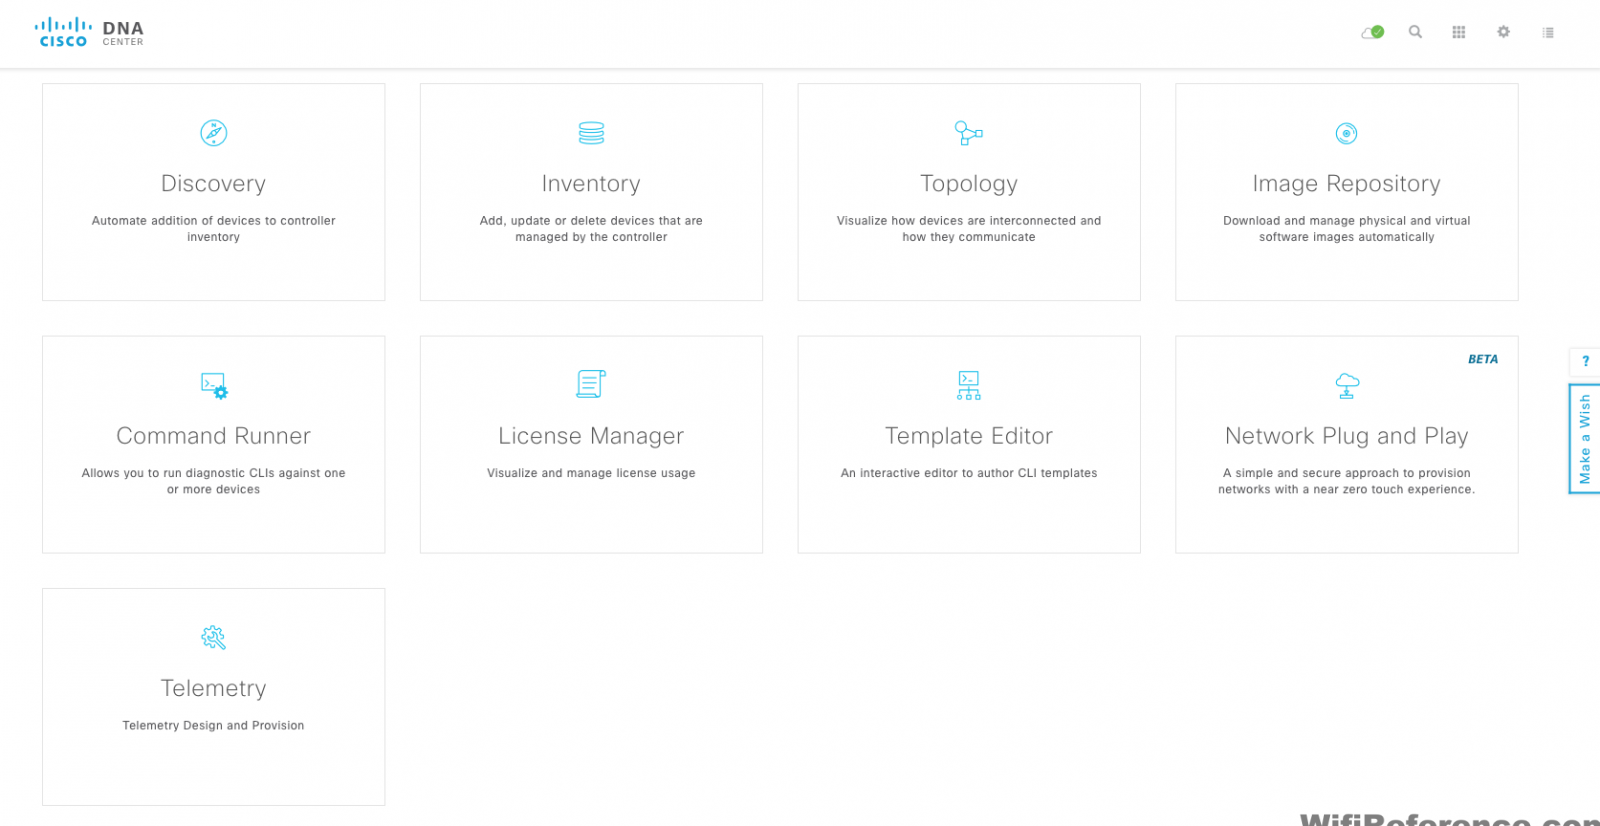
- Click the Tools button in the top-right corner of the screen. Anyone who has ever been through one of Aaron Woland’s presentations at Cisco Live will probably know this as the “Tic Tac Toe Button.”
Run a Discovery Job, to Discover a Large Number of Devices
To run a Discovery, click the Tools button and choose Discovery
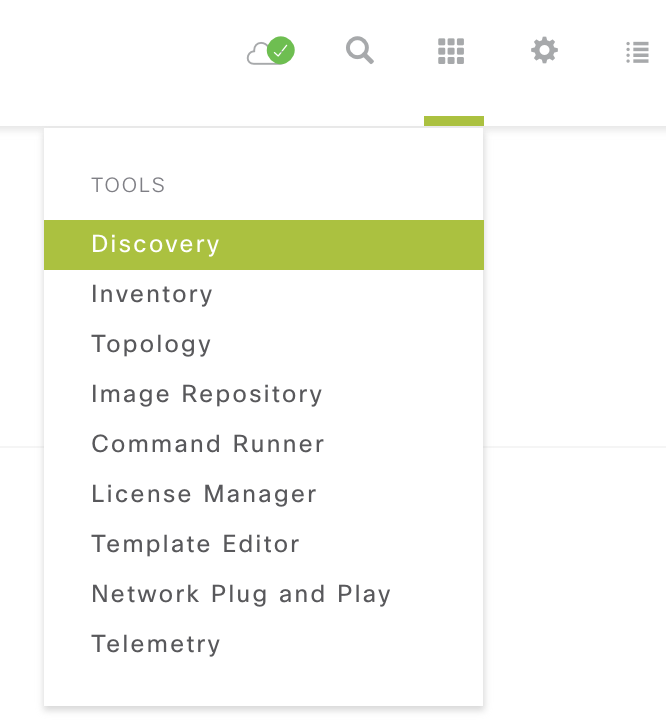
This process is fairly intuitive, and not unlike other Network Management Systems, so I won’t cover it in detail. Simply input a seed device, choose the method (CDP, LLDP, etc.), and how many hops.
Once you have devices in your Inventory
After you have added some devices to your inventory, you will want to check to make sure they are being properly managed. You can do this by visiting the same inventory screen I mentioned above. It will list the devices, and their reachability status. Take a look at the “Last Sync Status” column, and make sure they all say Managed.
Once you’ve determined that your devices have been properly detected/managed, you can assign them to a site. This is important for a couple reasons. You may want your devices to inherit configuration (NTP servers, DNS servers, AAA servers, etc.) on a per-building basis. It is also important because this hierarchy is where the wireless maps / floor plans live.
To assign devices to sites, you must first create the sites. This needs to be done in the “Design” section of the UI. Click back to the main screen, and then click the link below Design that says “Add site locations on the network.” This will take you to the Network Hierarchy section of the Design menu. Click on the “Add Site” button and add an Area. An Area is equivalent to what a Campus was in Prime Infrastructure. It is a collection of buildings.
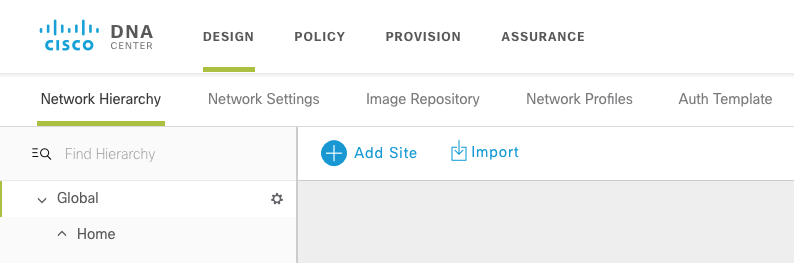
Once you have an Area, add a Building, and then Floors. Adding a floor will allow you to import a map floor plan file, for displaying your APs and clients. This process is very similar to Prime Infrastructure, so I won’t cover it in detail.
Network Settings in the Network Hierarchy
In the Design Menu, take a look at the Network Settings tab. You’ll notice that you can configure some basic settings, such as AAA server, DNS Server, Syslog Server, SNMP Trap Host, and Time Zone for each section of your hierarchy. This allows you to have these settings “set” for each Area, Building or Floor, and the devices associated to that floor can be made to automatically inherit that configuration.
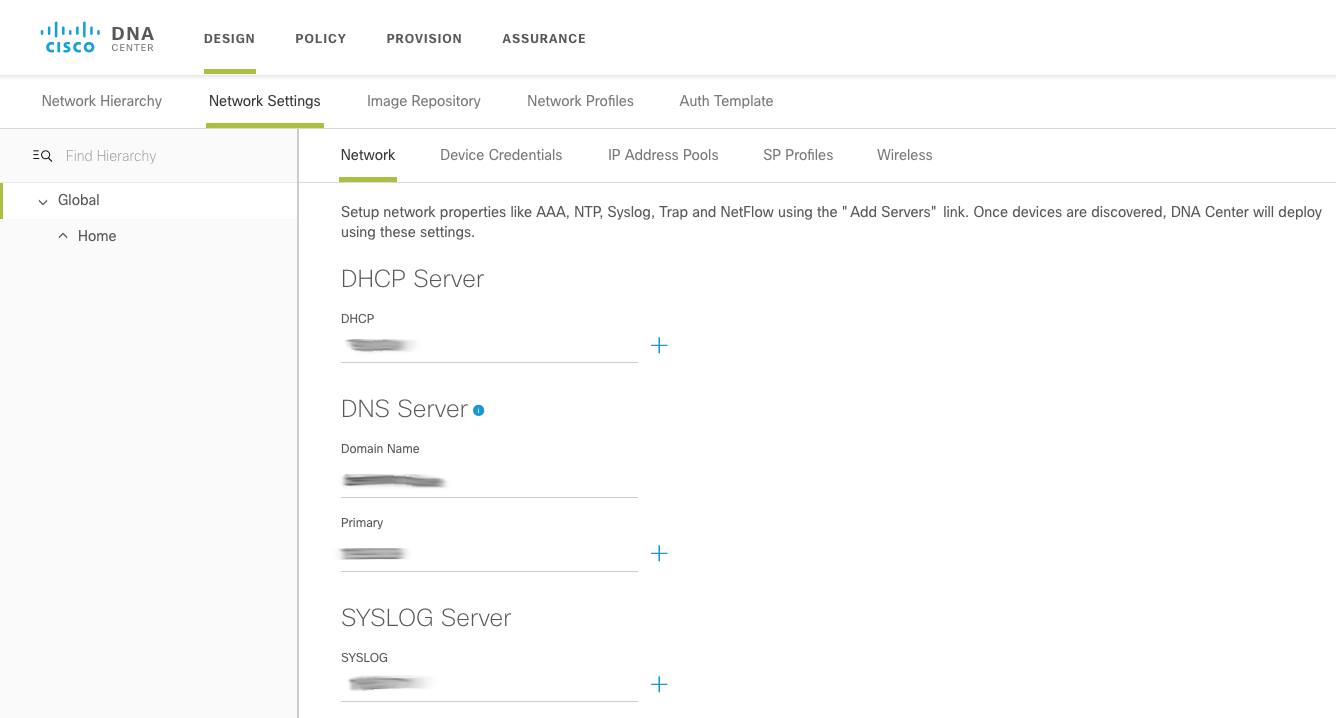
There is also an Image Repository tab, where you can designate software images to different sites, etc.
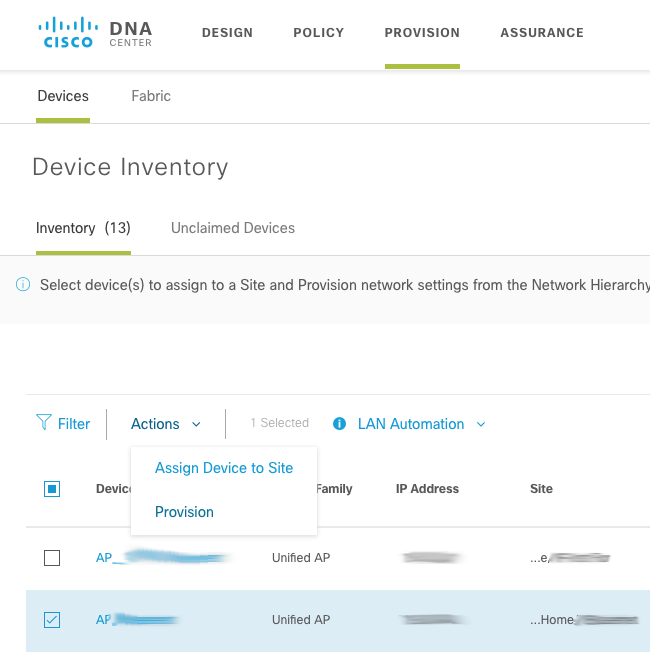
All of this automatic inheritance is done in the Provision section of the GUI. Here will will see a screen that is strikingly similar to the Inventory screen, but the options for each device are different. Under Actions, you can “Provision” a device. This will push the inheritable configuration for that site to the device(s) you select.
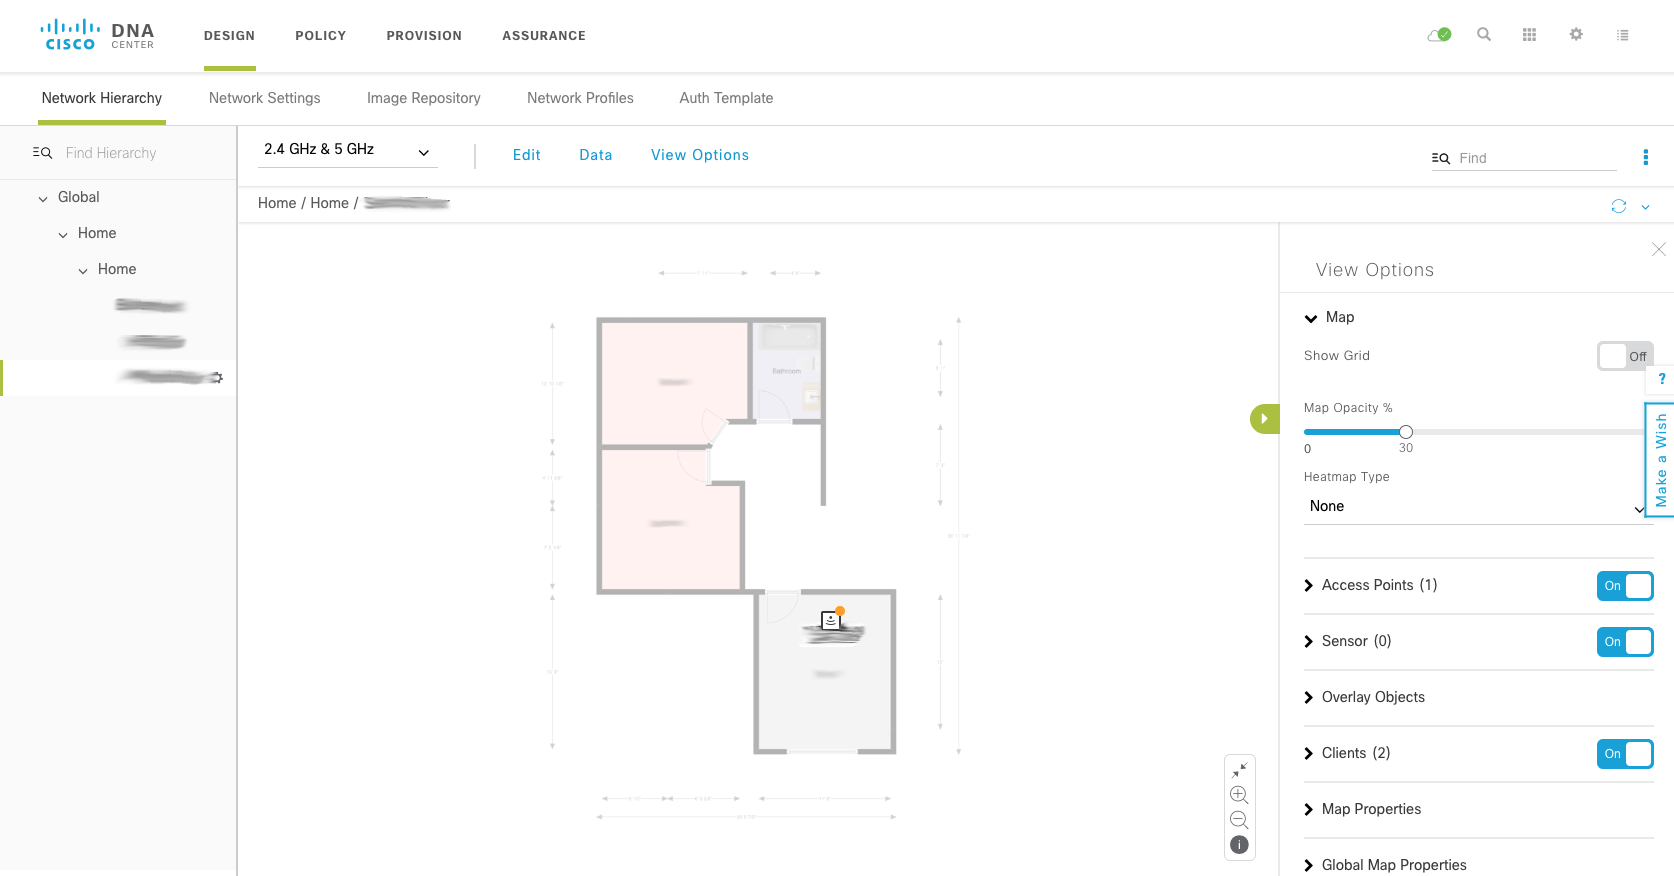
Maps
DNA Center Maps share some similarities with the later versions of Prime Infrastructure. However, they are also lacking a lot of the newer features that appeared in Prime Infrastructure 3.2+. The most notable omissions are features that have always required MSE/CMX integration. The lack of automatic line drawing between clients and APs, based on their association is one of the first things I noticed. I really grew to appreciate that in the later couple versions of Prime Infrastructure. The ability to depict client RSSI/SNR with the color of the client icon is also not currently possible with DNA Center. I expect that these features will be added in a future release.
Assurance – Application, Network and Client Health
In my opinion, the most exciting part of DNA Center is the visibility into the health of various parts of your network (Devices, Clients and Applications). This is what Cisco is calling Assurance, and all of this information can be accessed under the Assurance menu.
In order to see this information, you must enable Network Telemetry on the devices you want to see this type of data from. Typically, this is your WLCs, Switches and Routers. Since DNA Center is managing these devices, it should be quite simple to have it add the necessary configuration to your devices to enable Network Telemetry. Usually, that is the case. However, I ran into an issue here. I’ll explain that in a little bit.
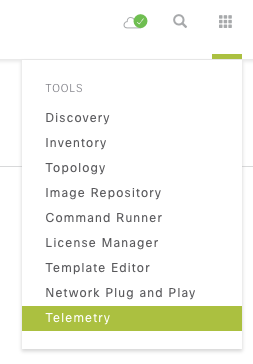
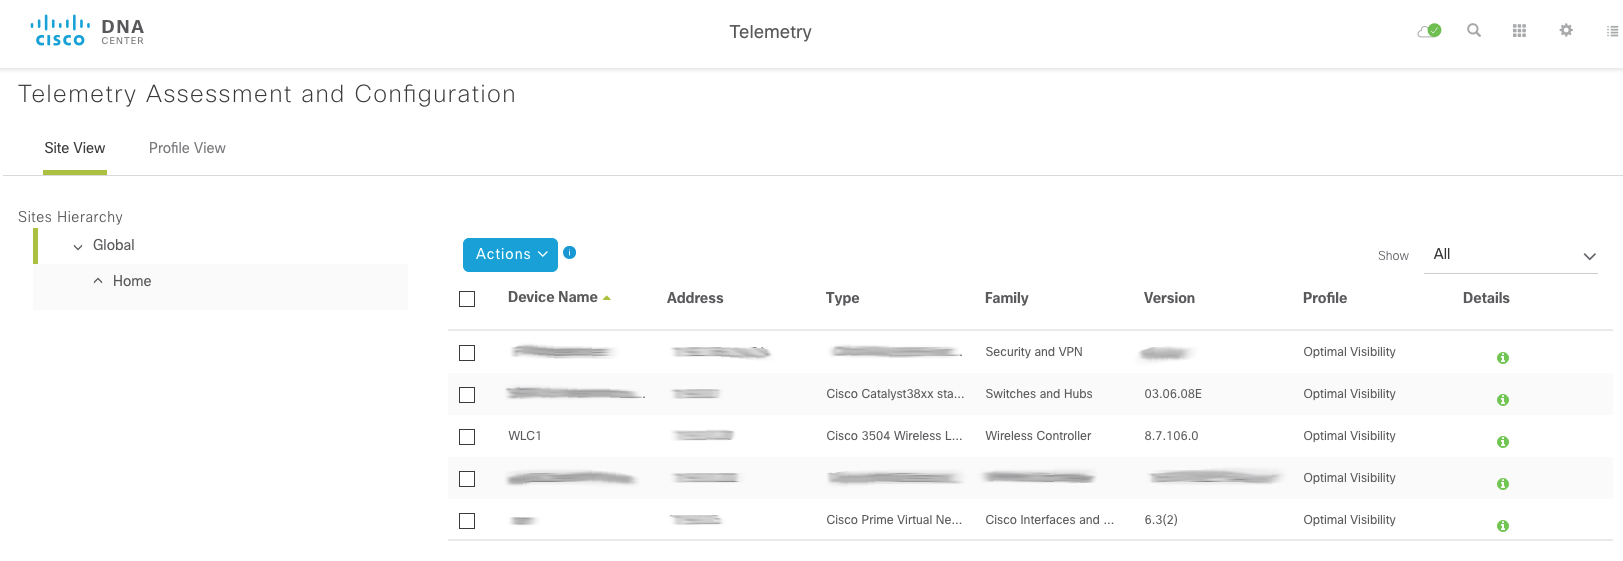
Start by selecting Telemetry in the Tools menu
Click the “Site View” tab, and select the devices on which you wish to enable Network Telemetry. Then pull down the Actions Menu and select Optimal Visibility. Some devices (Routers?) may allow you to select Maximal Visibility, however none of my devices would allow me to select it. Once you select the Optimal Visibility menu item, DNA Center will automatically configure your device(s) to send Network Telemetry back to the DNA Center Appliance. As I mentioned earlier, I had some very mixed results here. In my case, DNA Center did not make any configuration changes to my devices. I’m working with Cisco TAC to determine why that is the case. I suspect it is because I installed a wildcard certificate on my DNA Center Appliance, and most of the configuration examples I was able to find are utilizing a self-generated certificate using the IP address as the CN. In the meantime I simply made the changes to my device manually.
WLC Manual Network Telemetry Configuration
First of all, you need to be running at least version 8.5 on your WLC in order to be able to see Network Telemetry (8.7 introduces Webhook Telemetry for 3rd party applications).
You should only need to do this if the automatic telemetry configuration does not get pushed to your WLC. On the WLC, Network Telemetry is configured in the Management > Cloud Services > Telemetry > Network Assurance > Server menu, which is shown in the screenshot below:
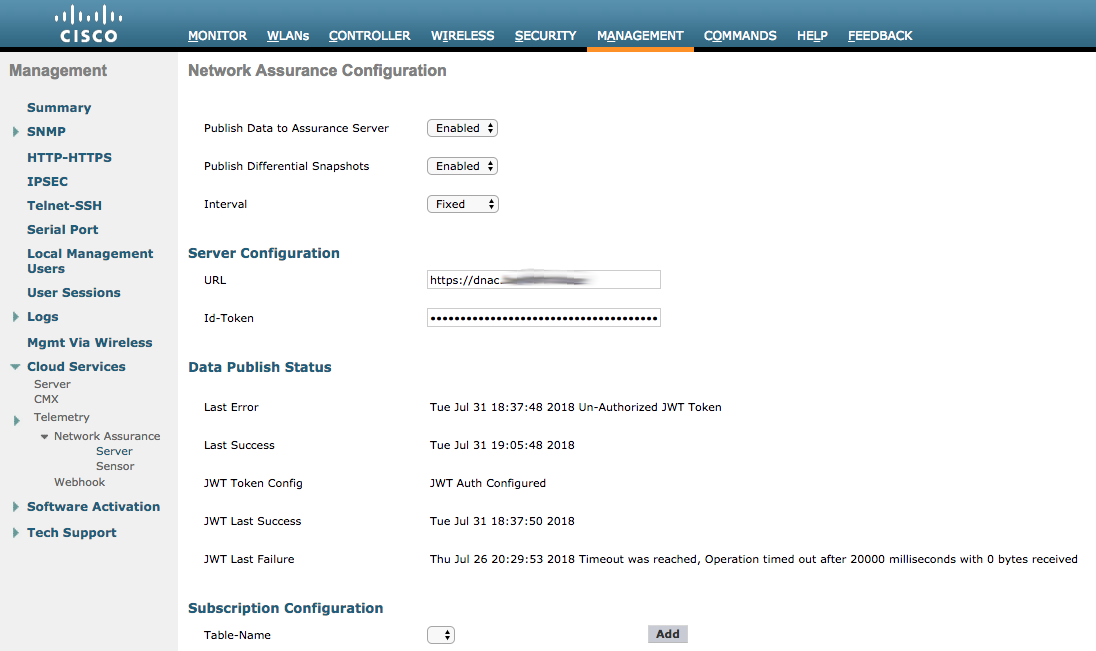
If your DNA Center Appliance properly pushed the configuration to your WLC, you will see a screen similar to that; with publishing enabled, and a URL & Token pre-populated. Your Data Publish Status should also have a timestamp in the “Last Success” field. If your experience is like mine, all of these fields will be disabled/blank. Time to hit the CLI, to fix the issue!
On the DNA Center Appliance
SSH to the DNA Center Appliance on port 2222 (this is important)
User: maglev
Password: [the password you input during the initial configuration wizard]

Step 1: Generate the Token
$ maglev login -u <admin> -p <GUI password> -c <DNAC IP address>

Step 2: Check/obtain the token that is generated from the above step (you will need this later)
$ cat .maglevconf

Step 3: Generate the .pem file.  The file will need to be transferred to the WLC
$ curl http://<DNAC IP address>/ca/pem > dna_cert.pem
On the Wireless Controller
Step 4: Configure the WLC
(Cisco Controller) >config network assurance server url <DNAC IP address>
(Cisco Controller) >config network assurance server id-token <the Token that was generated in DNAC>

Step 5: Transfer the DNAC generated .pem file to the WLC
transfer download mode sftp
transfer download datatype NA-Server-CA
transfer download serverip <DNAC IP address>
transfer download path <absolute SFTP server path to the update file>
transfer download filename [filename].pem
transfer download port 2222
transfer download username [username]
transfer download password [password]
transfer download start

Mode............................................. SFTP
Data Type........................................ NA-Server-CA
SFTP Server IP................................... <DNAC IP address>
SFTP Packet Timeout.............................. 6
SFTP Max Retries................................. 10
SFTP Path........................................./
SFTP Filename.................................... [filename].pem

This might take some time.
Are you sure you want to start? (y/N) y
SFTP WLC cert transfer starting.
Certificate installed.
Step 6: Verify the certificate is installed.
(Cisco Controller) > show network assurance summary (or visit the GUI page I referenced earlier)
At this point, you should start receiving Network Telemetry information from the WLC. You’ll know it’s working when you can see some information on the Assurance Overall Health page.
Now let’s dive into the Assurance data.
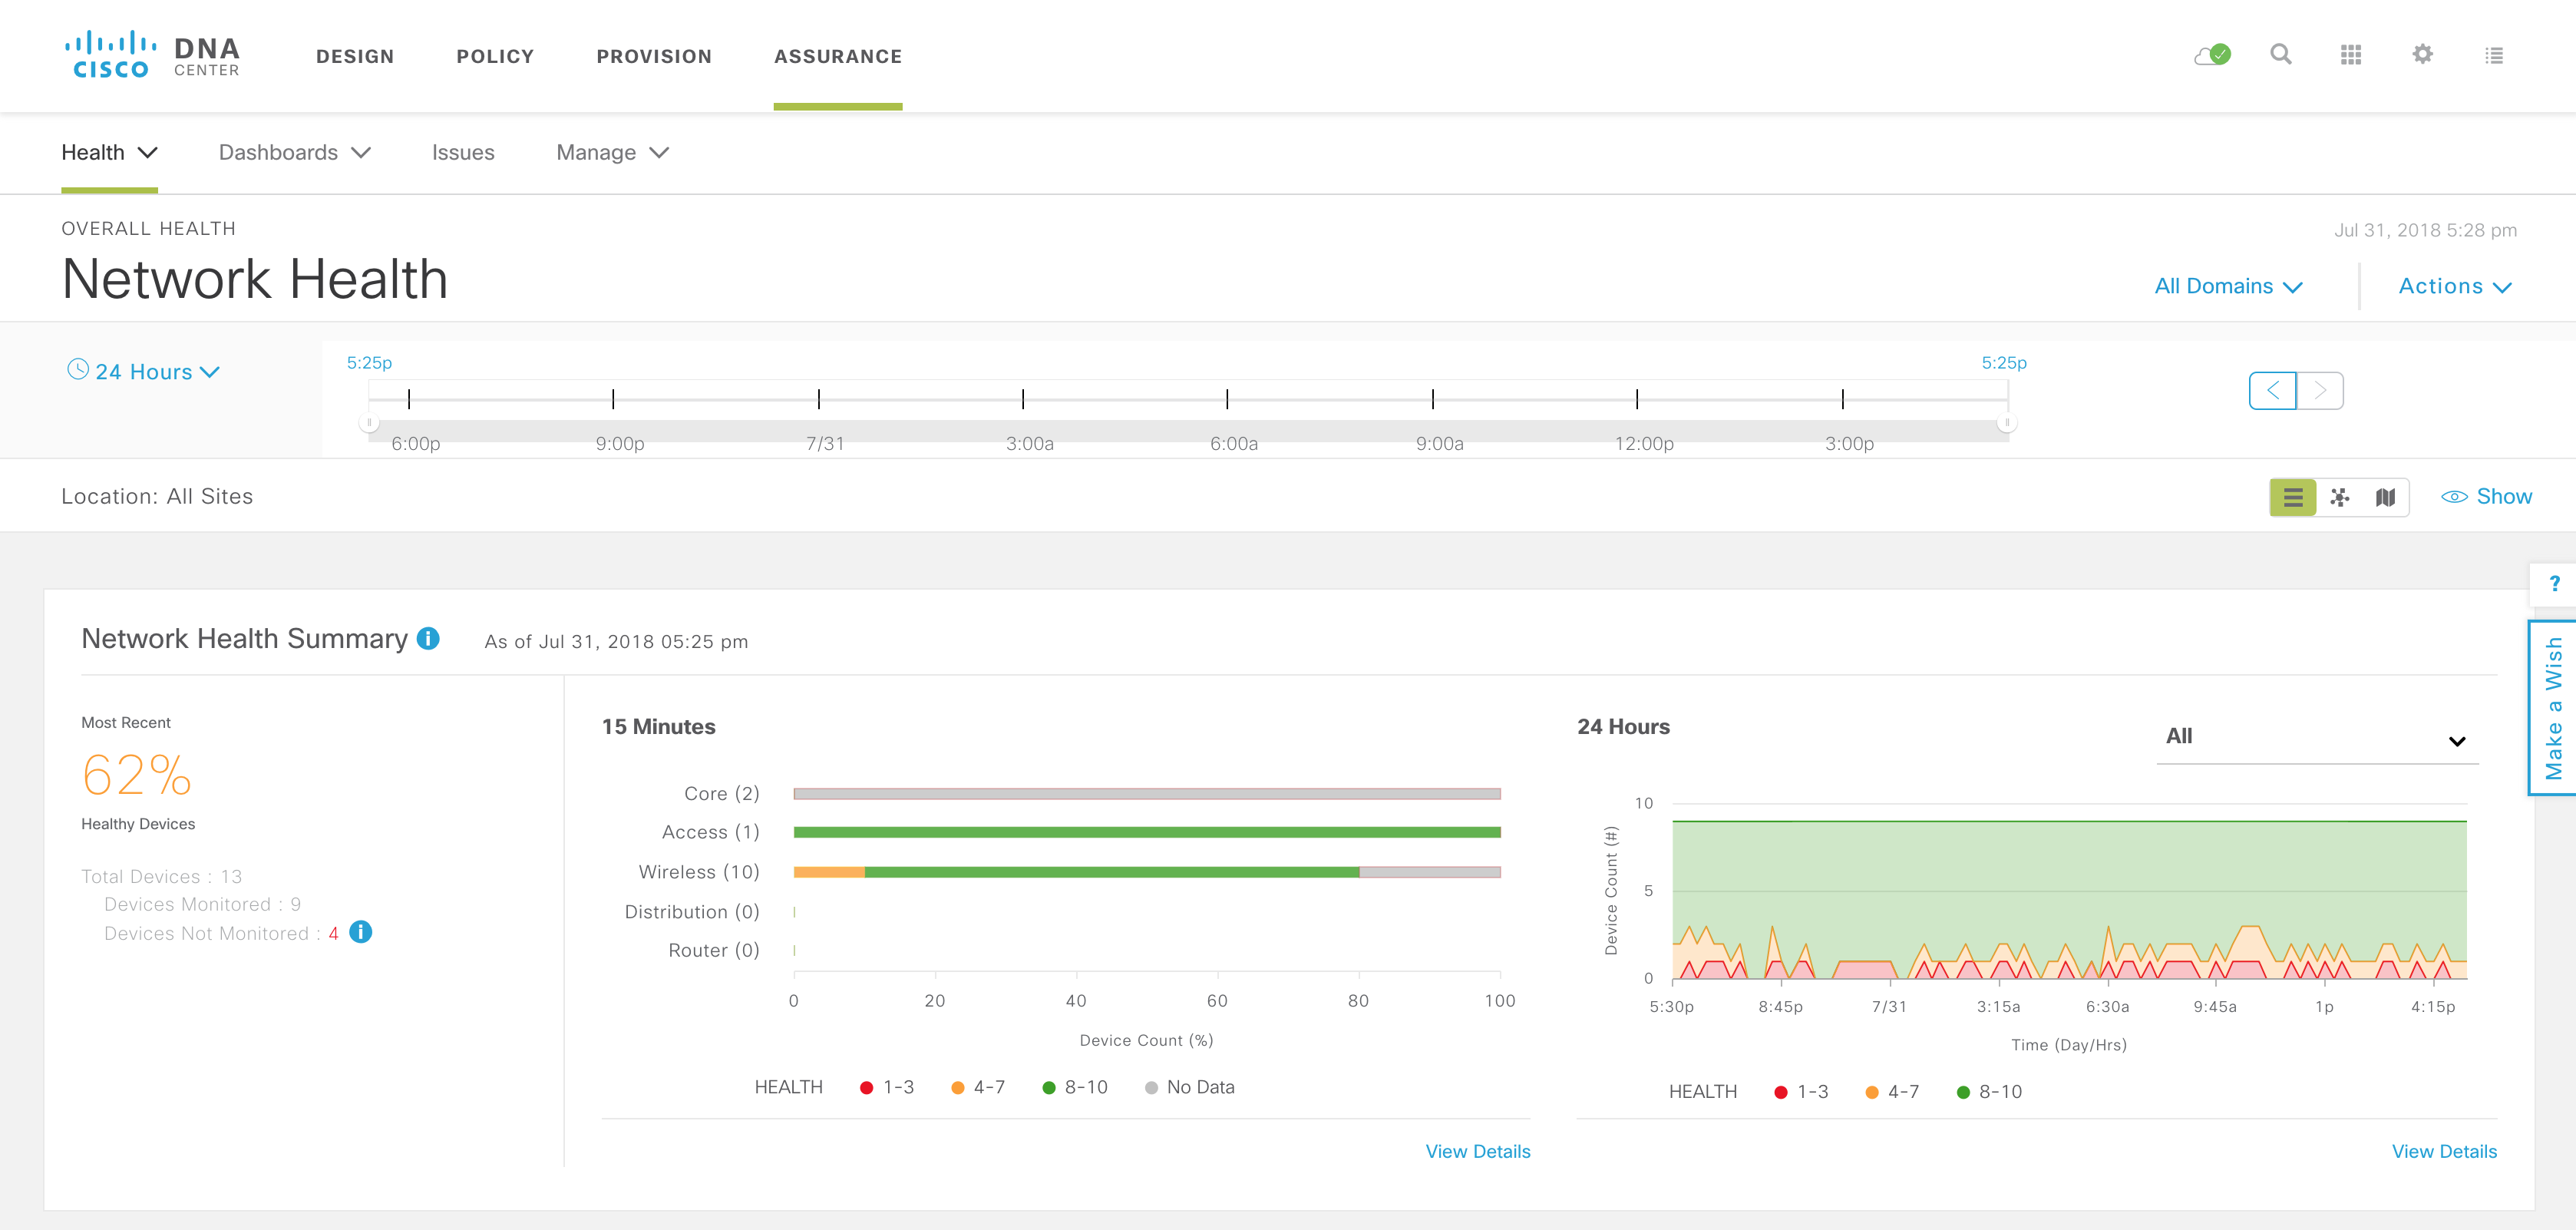
Client Health
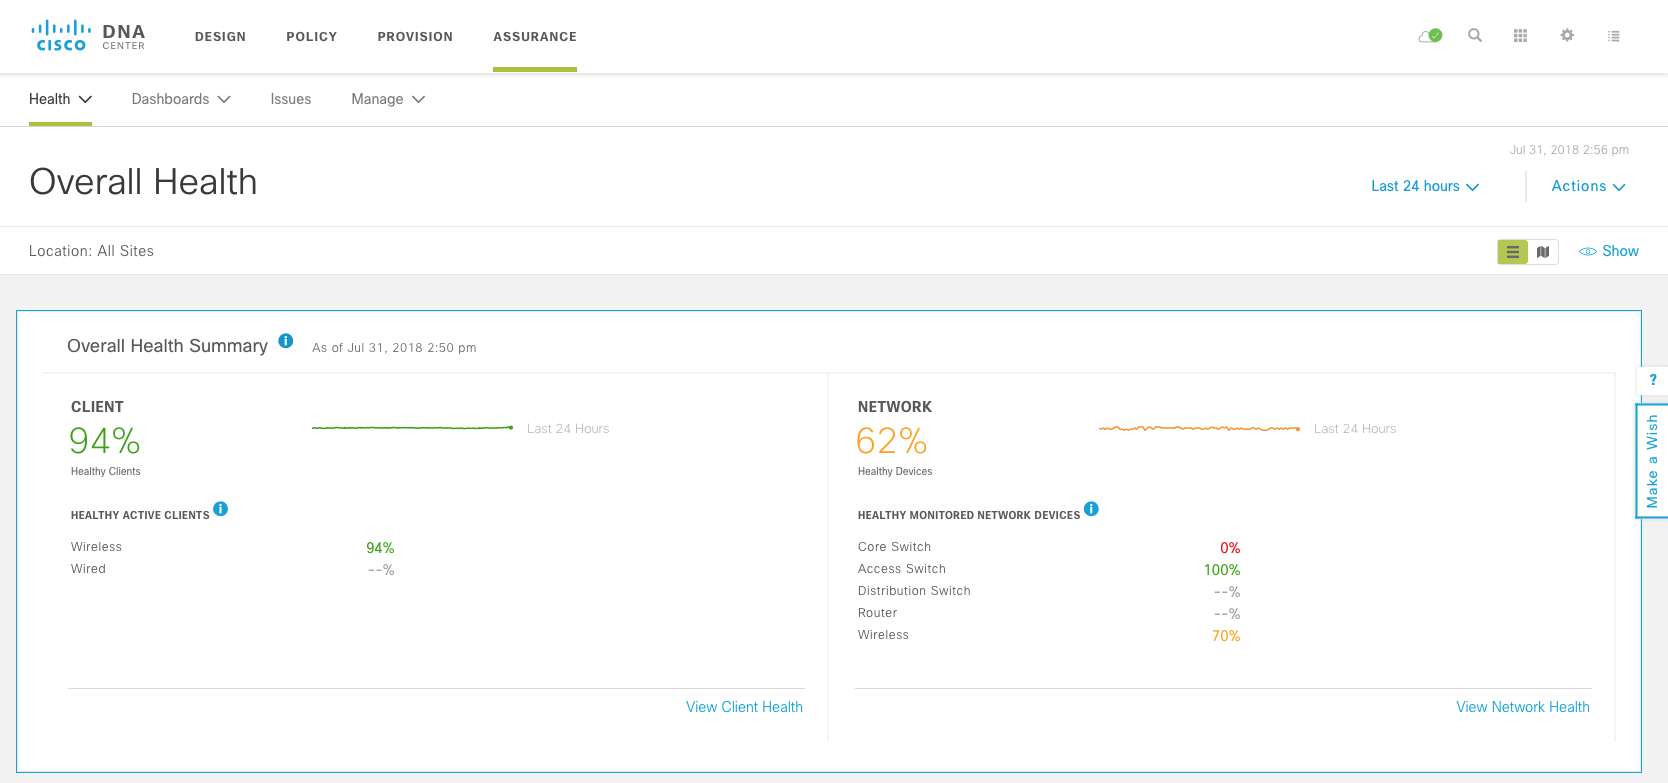
The Overall Health page will give you a summary of your Client Health, as well as Network Health. There is a nice line graph that shows the overall health of your client base (both wired and wireless) for the past 24 hours. It’s easy to tell if things are degrading, improving, or holding steady. It will also give you a percentage of your healthy clients, for both wired and wireless.
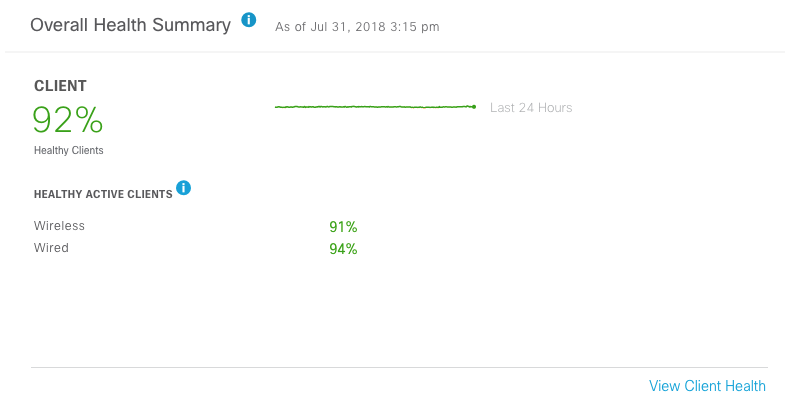
You may be asking yourself, what determines the health of a client? For wireless clients, this is primarily determined based on the onboarding time (auth, assoc, aaa, dhcp), the RSSI, and the SNR for the client connection.
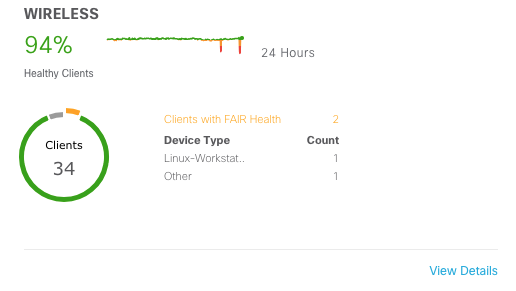
Drilling into the details of the client health will break it down into wireless and wired clients
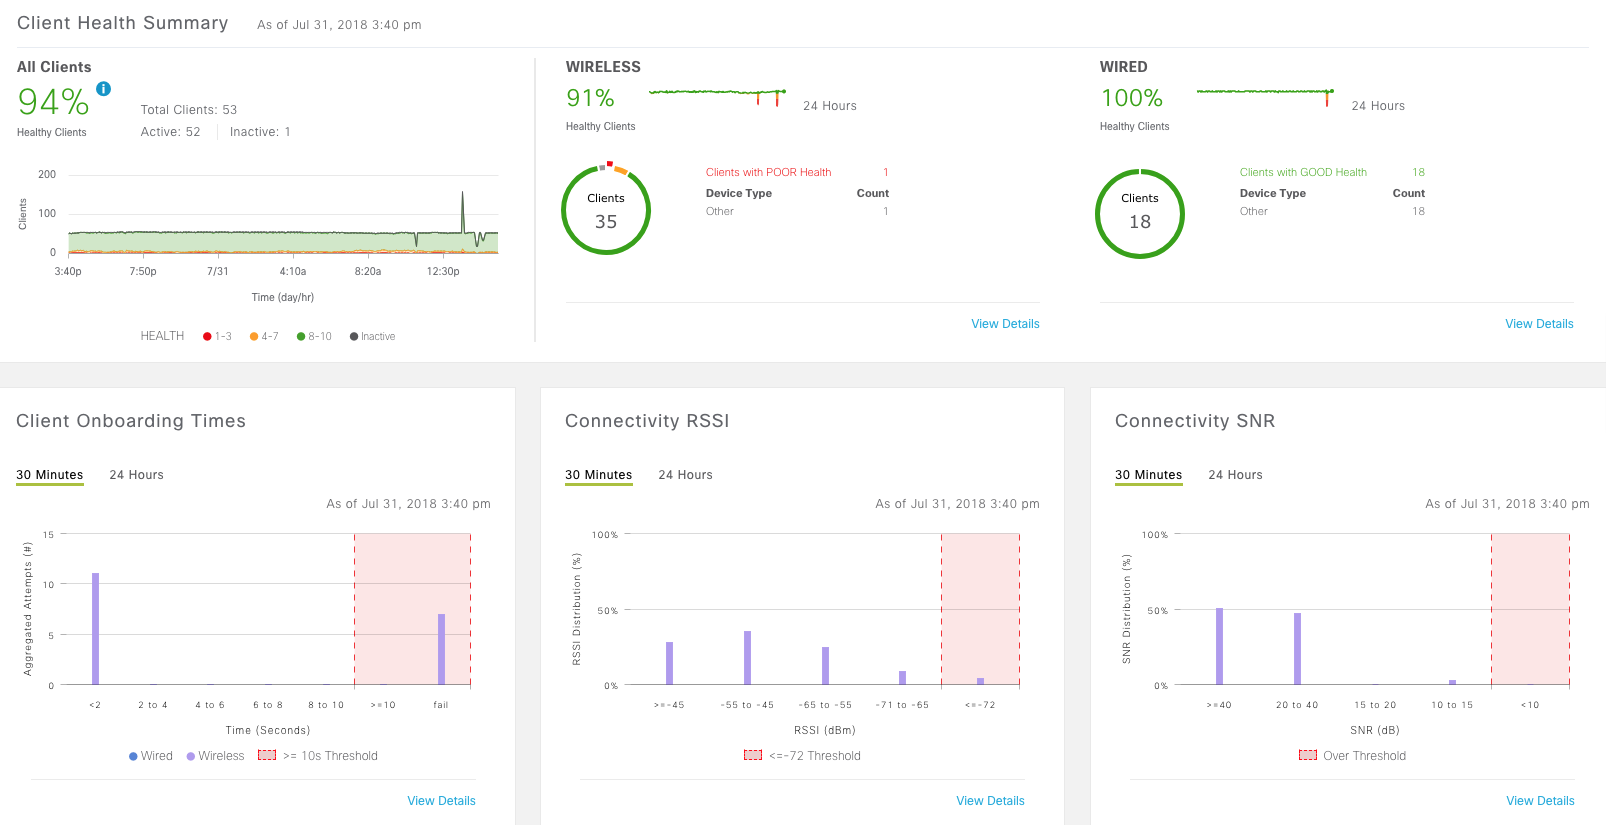
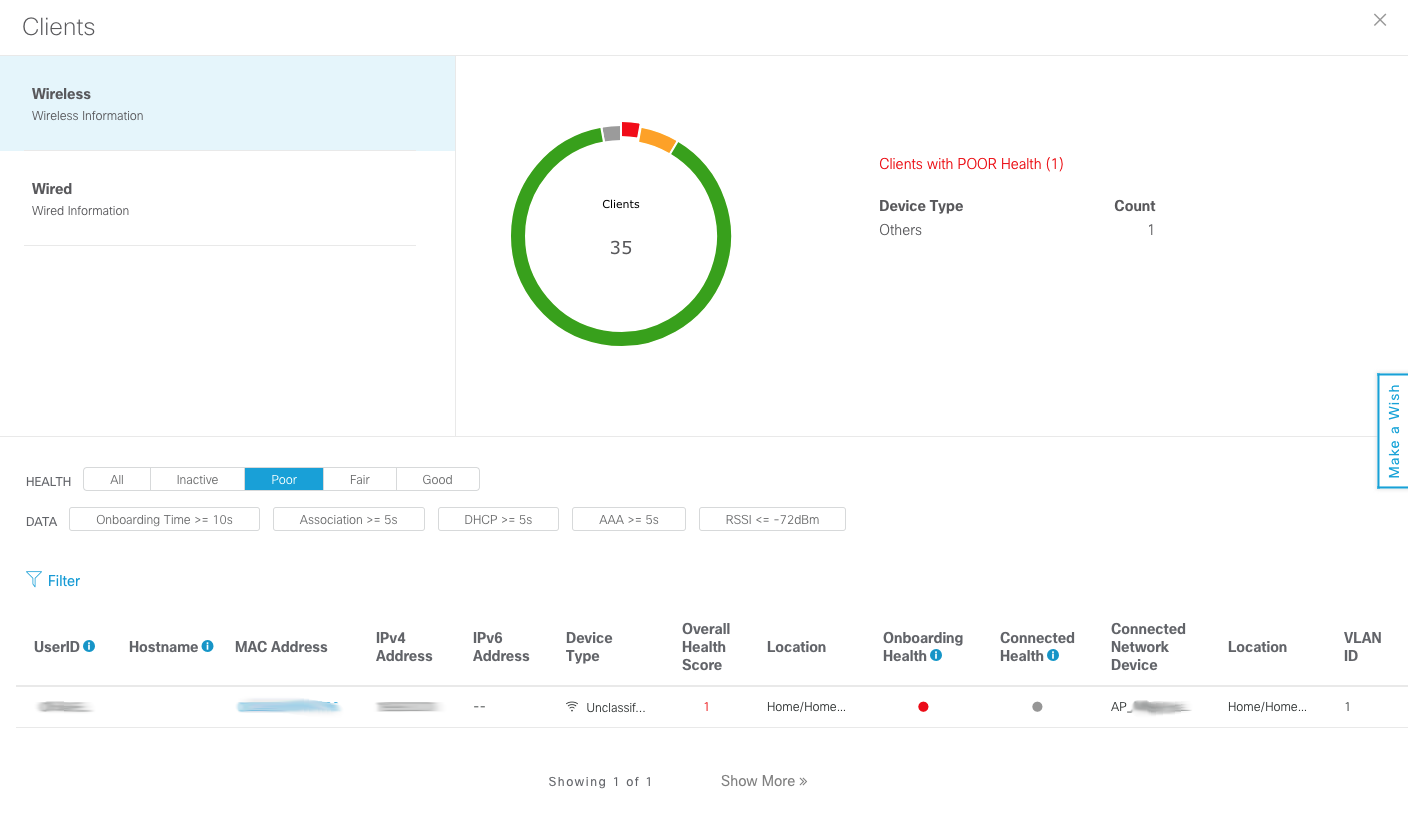
Drilling into the wireless client health will show you the specific clients that are considered to have “poor” or “fair” health
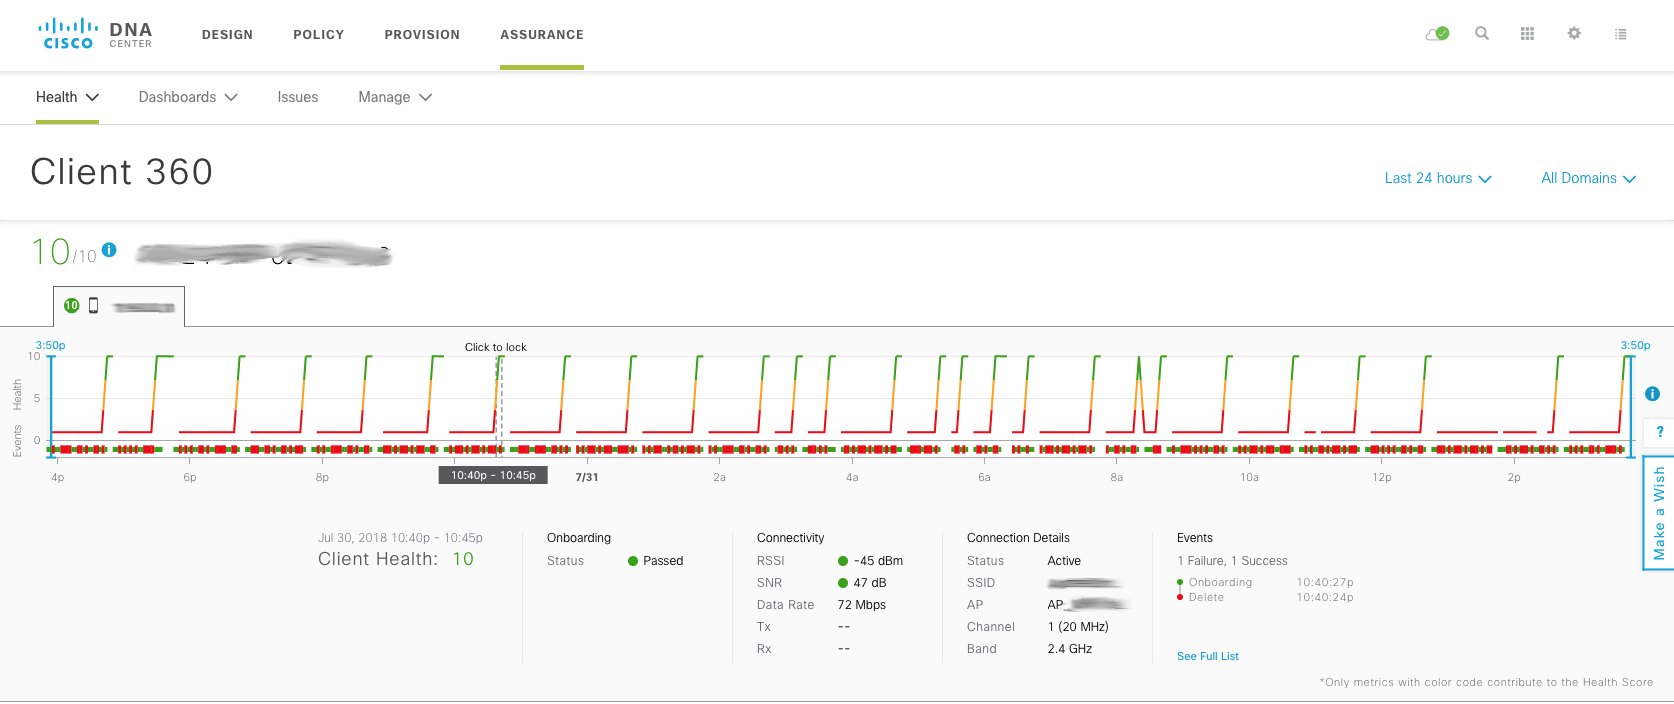
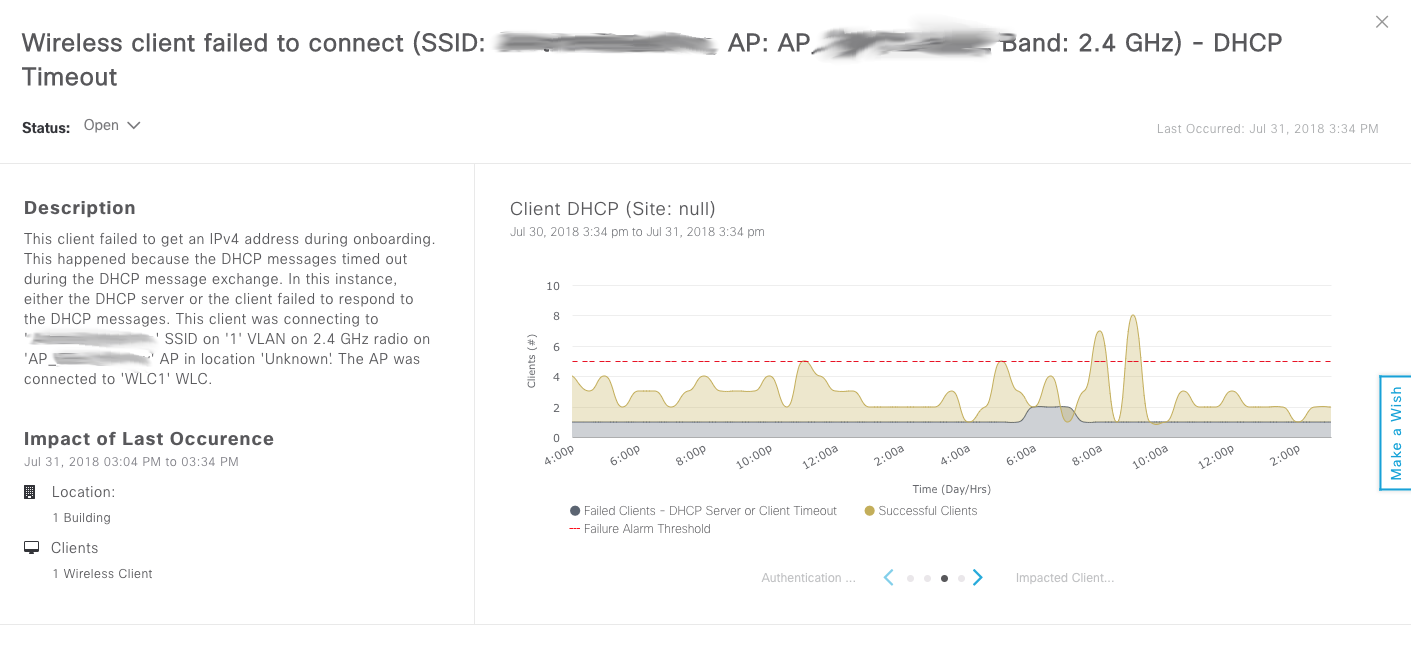
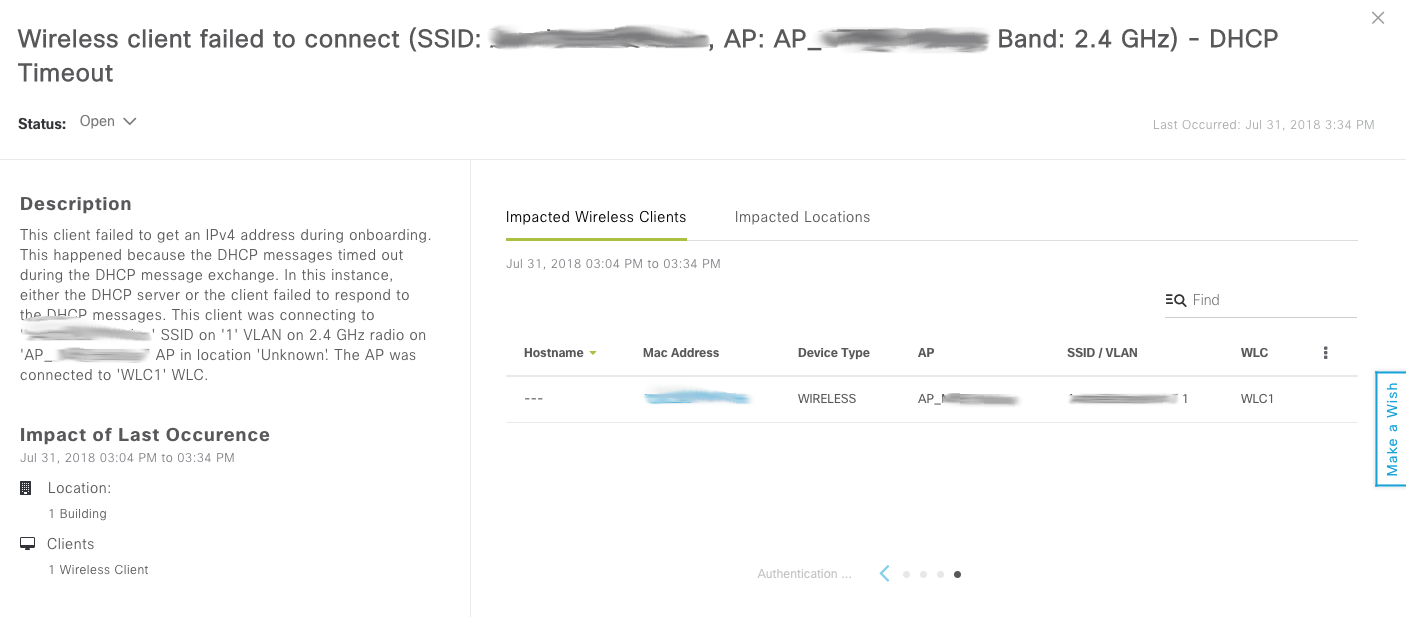
Clicking on the MAC address of a specific client will take you to the Client 360 View. This screen gives you an incredible amount of detail (and history) of the client connection. Much more detail than you were able to see on Prime Infrastructure’s Client 360 View. Here you will see a timeline, depicting the client health over the last 24 hours. This timeline has two items on it: Health and Events. Health is a 0-10 score, represented by the colored line graph. Below the line graph, you will see some red/green boxes. These are successful and failed onboarding events. You can hover over this timeline graph and see the details at that point in time.
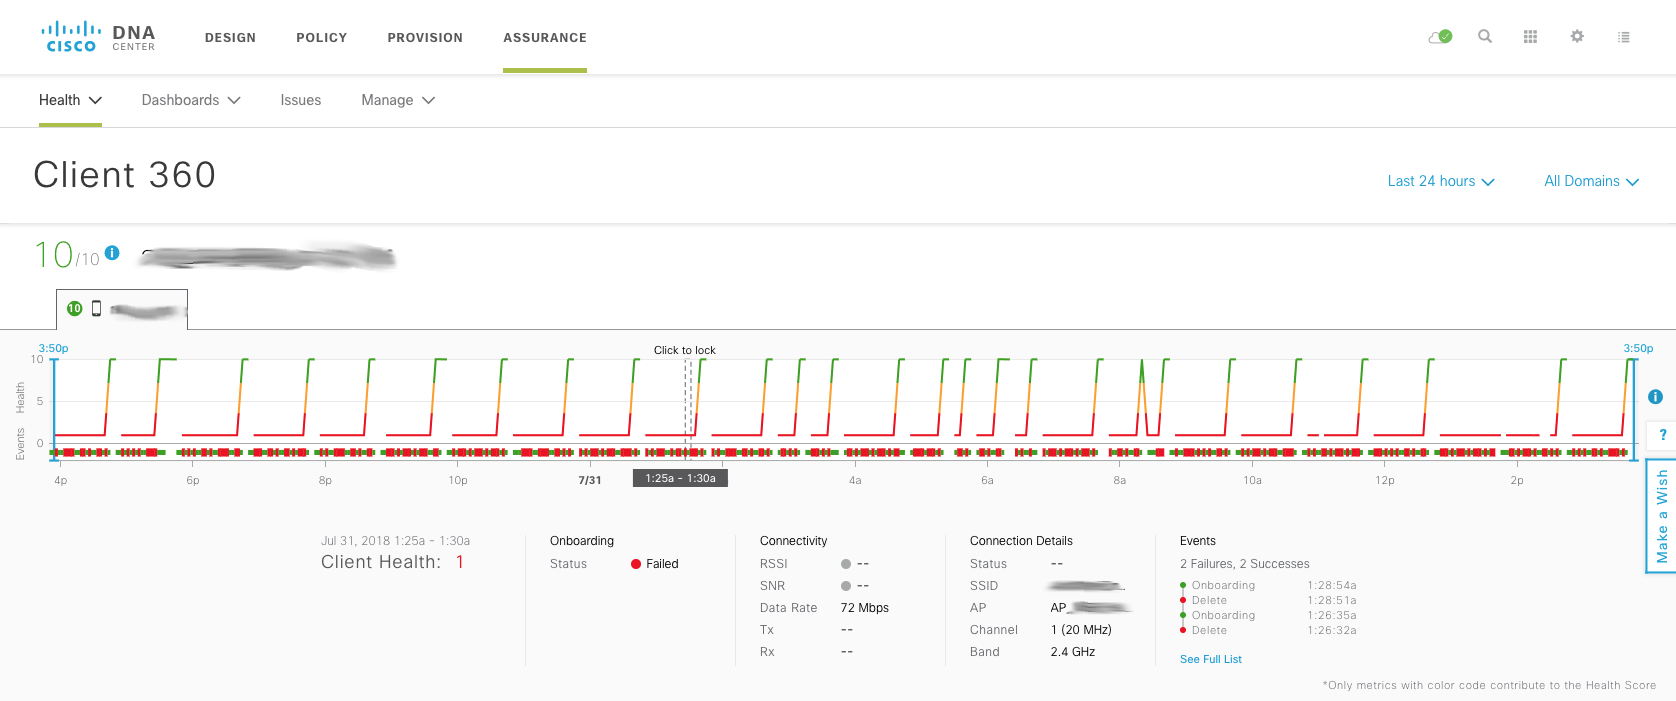
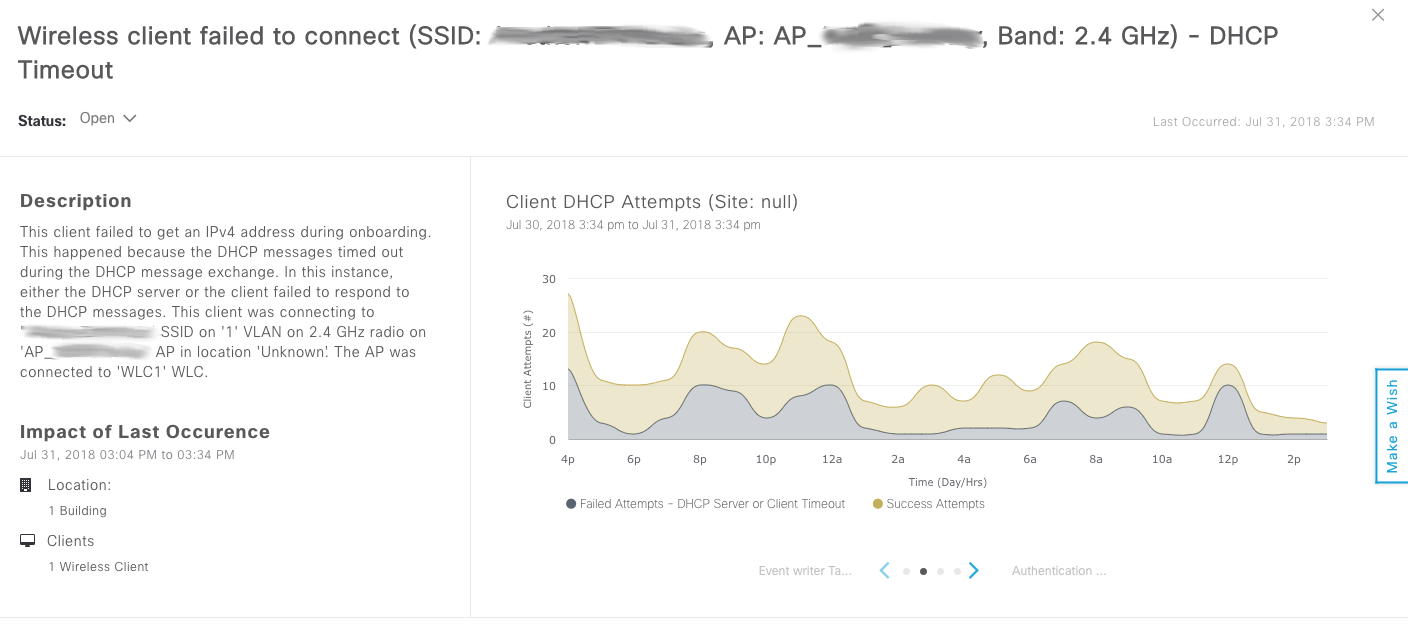
Below the timeline, you will see a list of issues, with an occurrence counter for each. I’ve found these issues to be explained very well, and if you click on them you get an even more detailed explanation of the issue (with suggested remediation actions). In this particular case, I’m showing a very badly behaving client. It is a Smart Scale that was apparently manufactured before they knew how to make a client sleep properly. This scale checks in about once an hour, and actually authenticates to the network. The rest of the time, it stays in a half-associated state, where it never finishes the DHCP handshake. This half-associated state is responsible for all of the red on the graph.
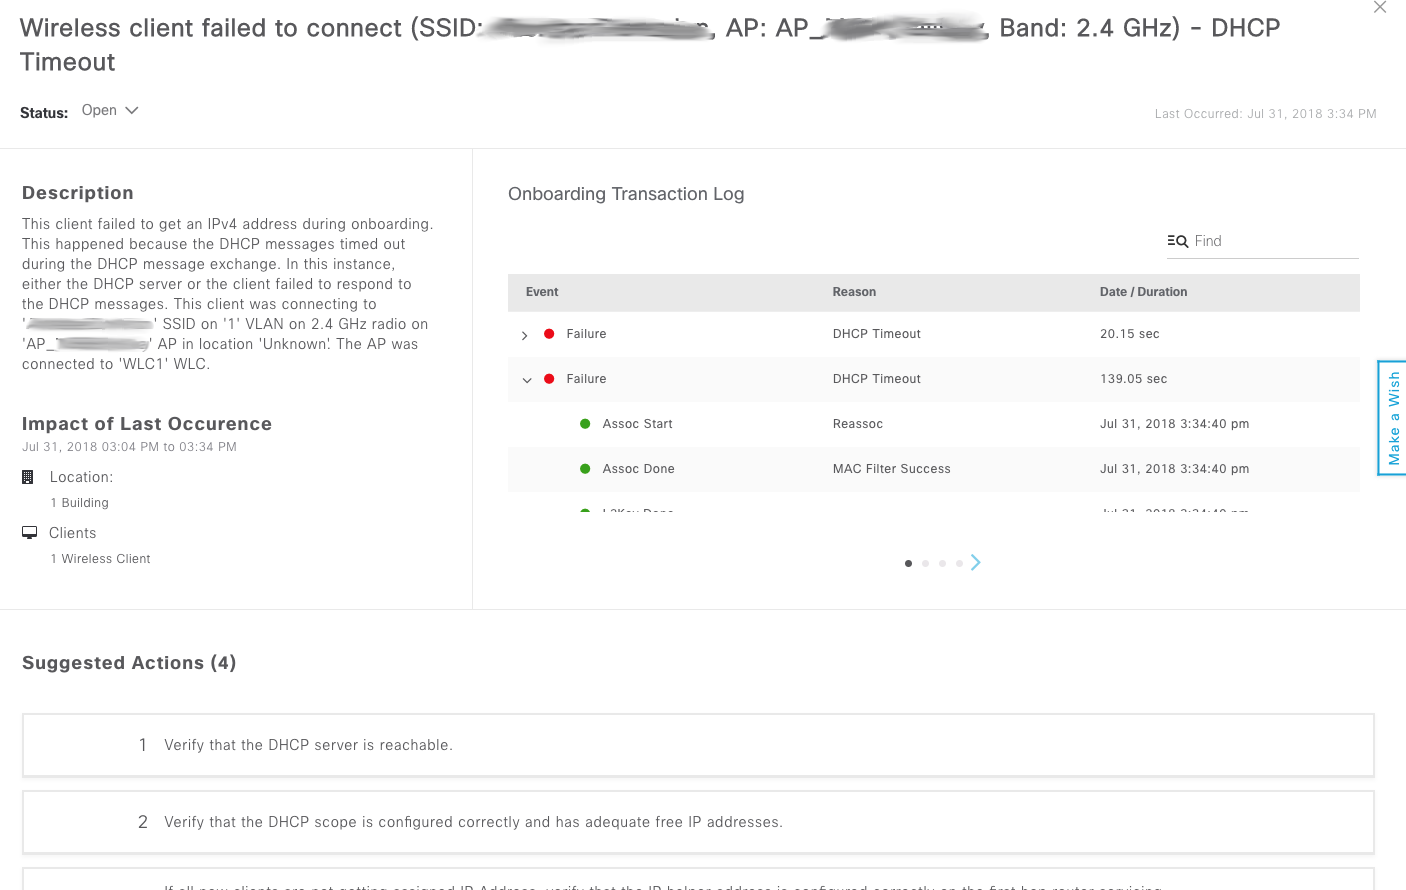
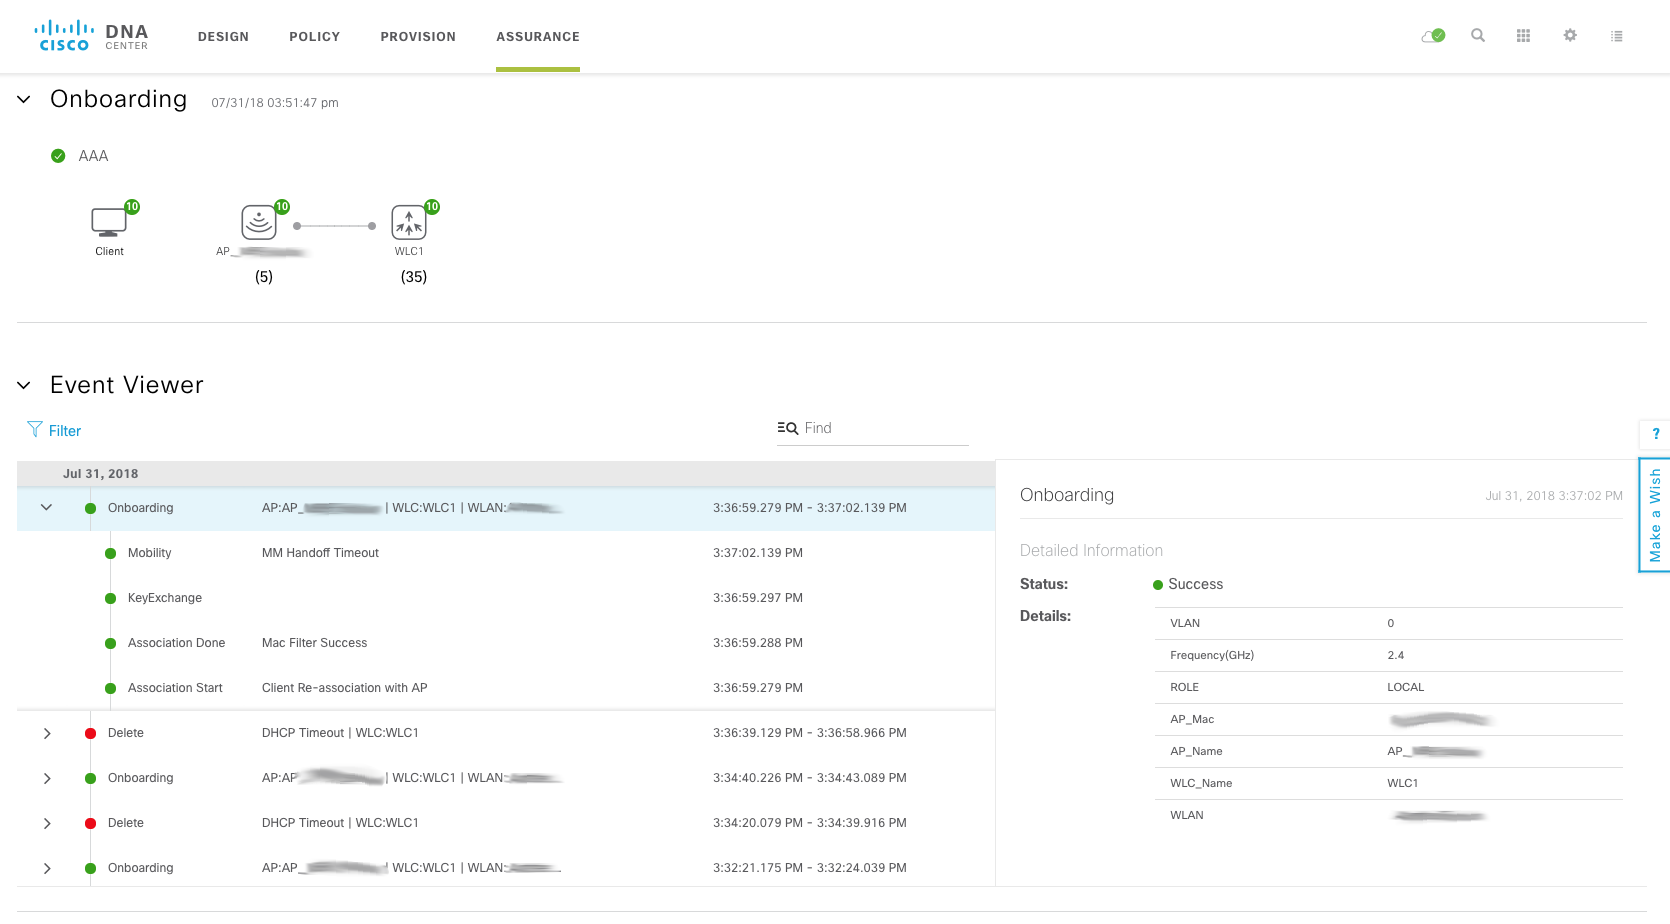
Scrolling down will reveal the details of the onboarding process, including successes and failures. This is available for all clients, even if they aren’t having issues. The timestamps are broken down to the millisecond. It’s interesting to see how slowly some clients go through this process, and how quickly others will.
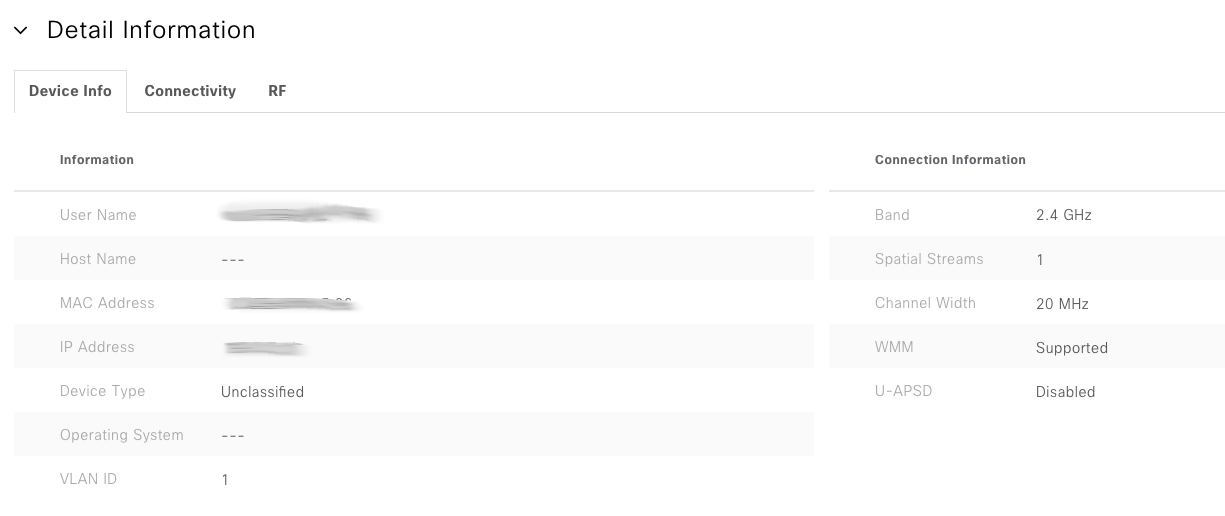
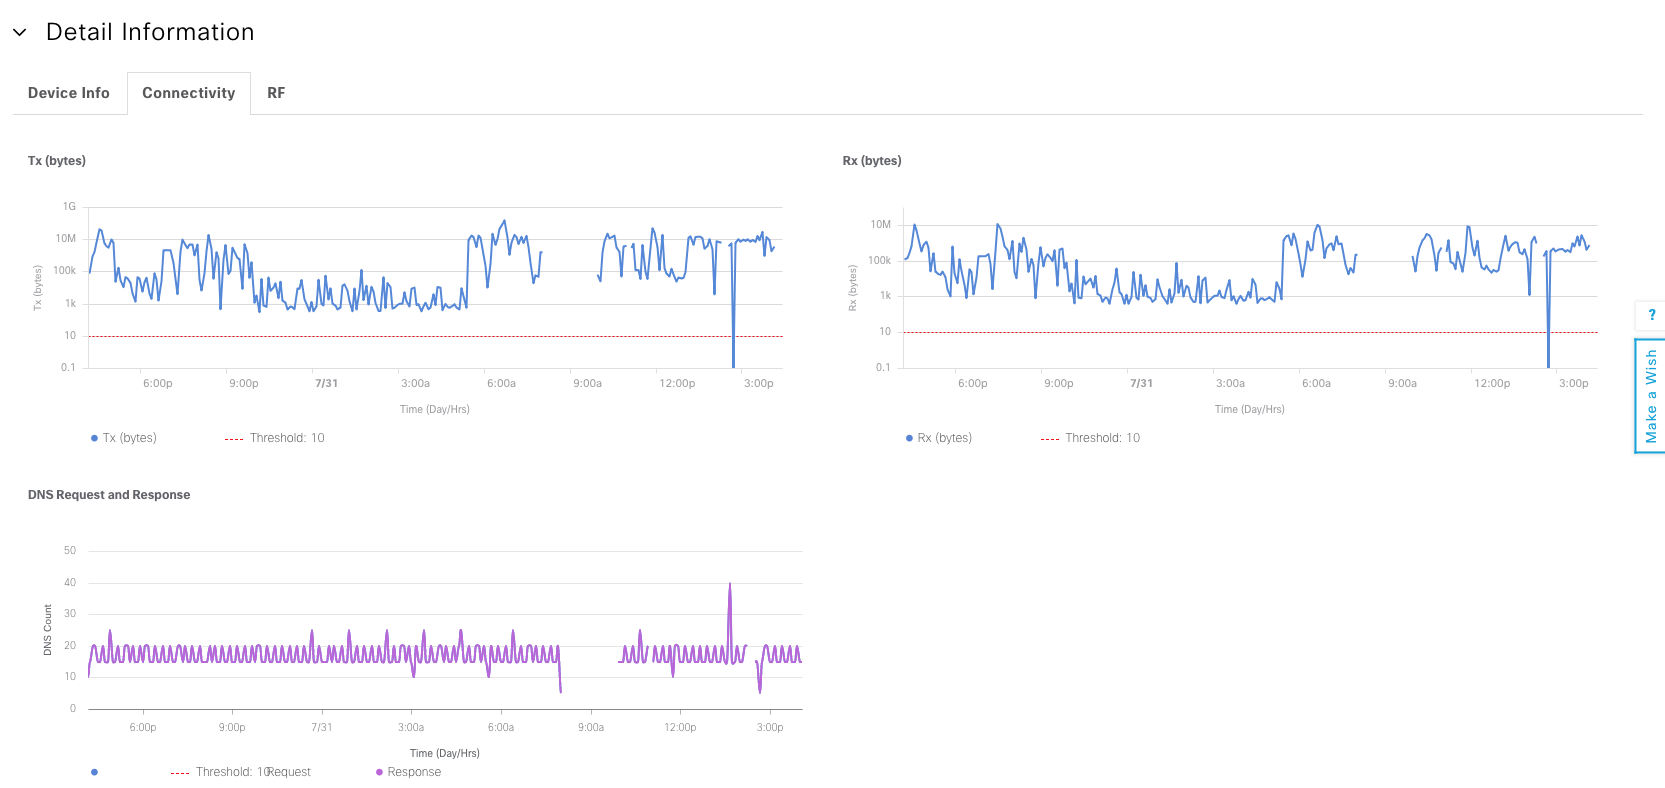
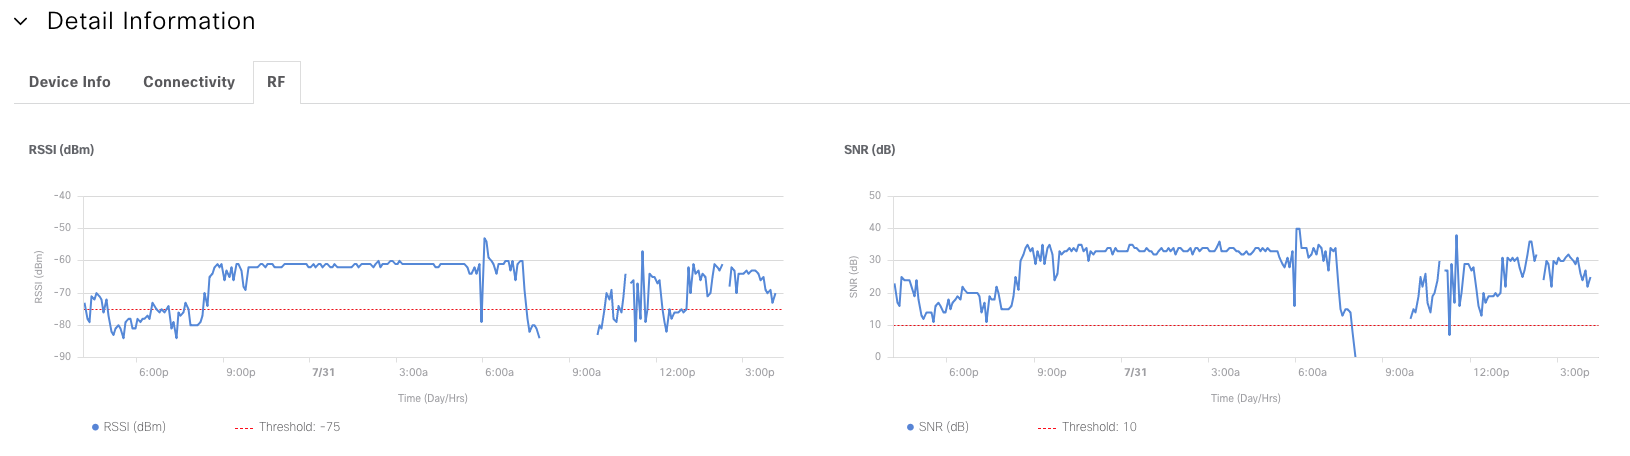
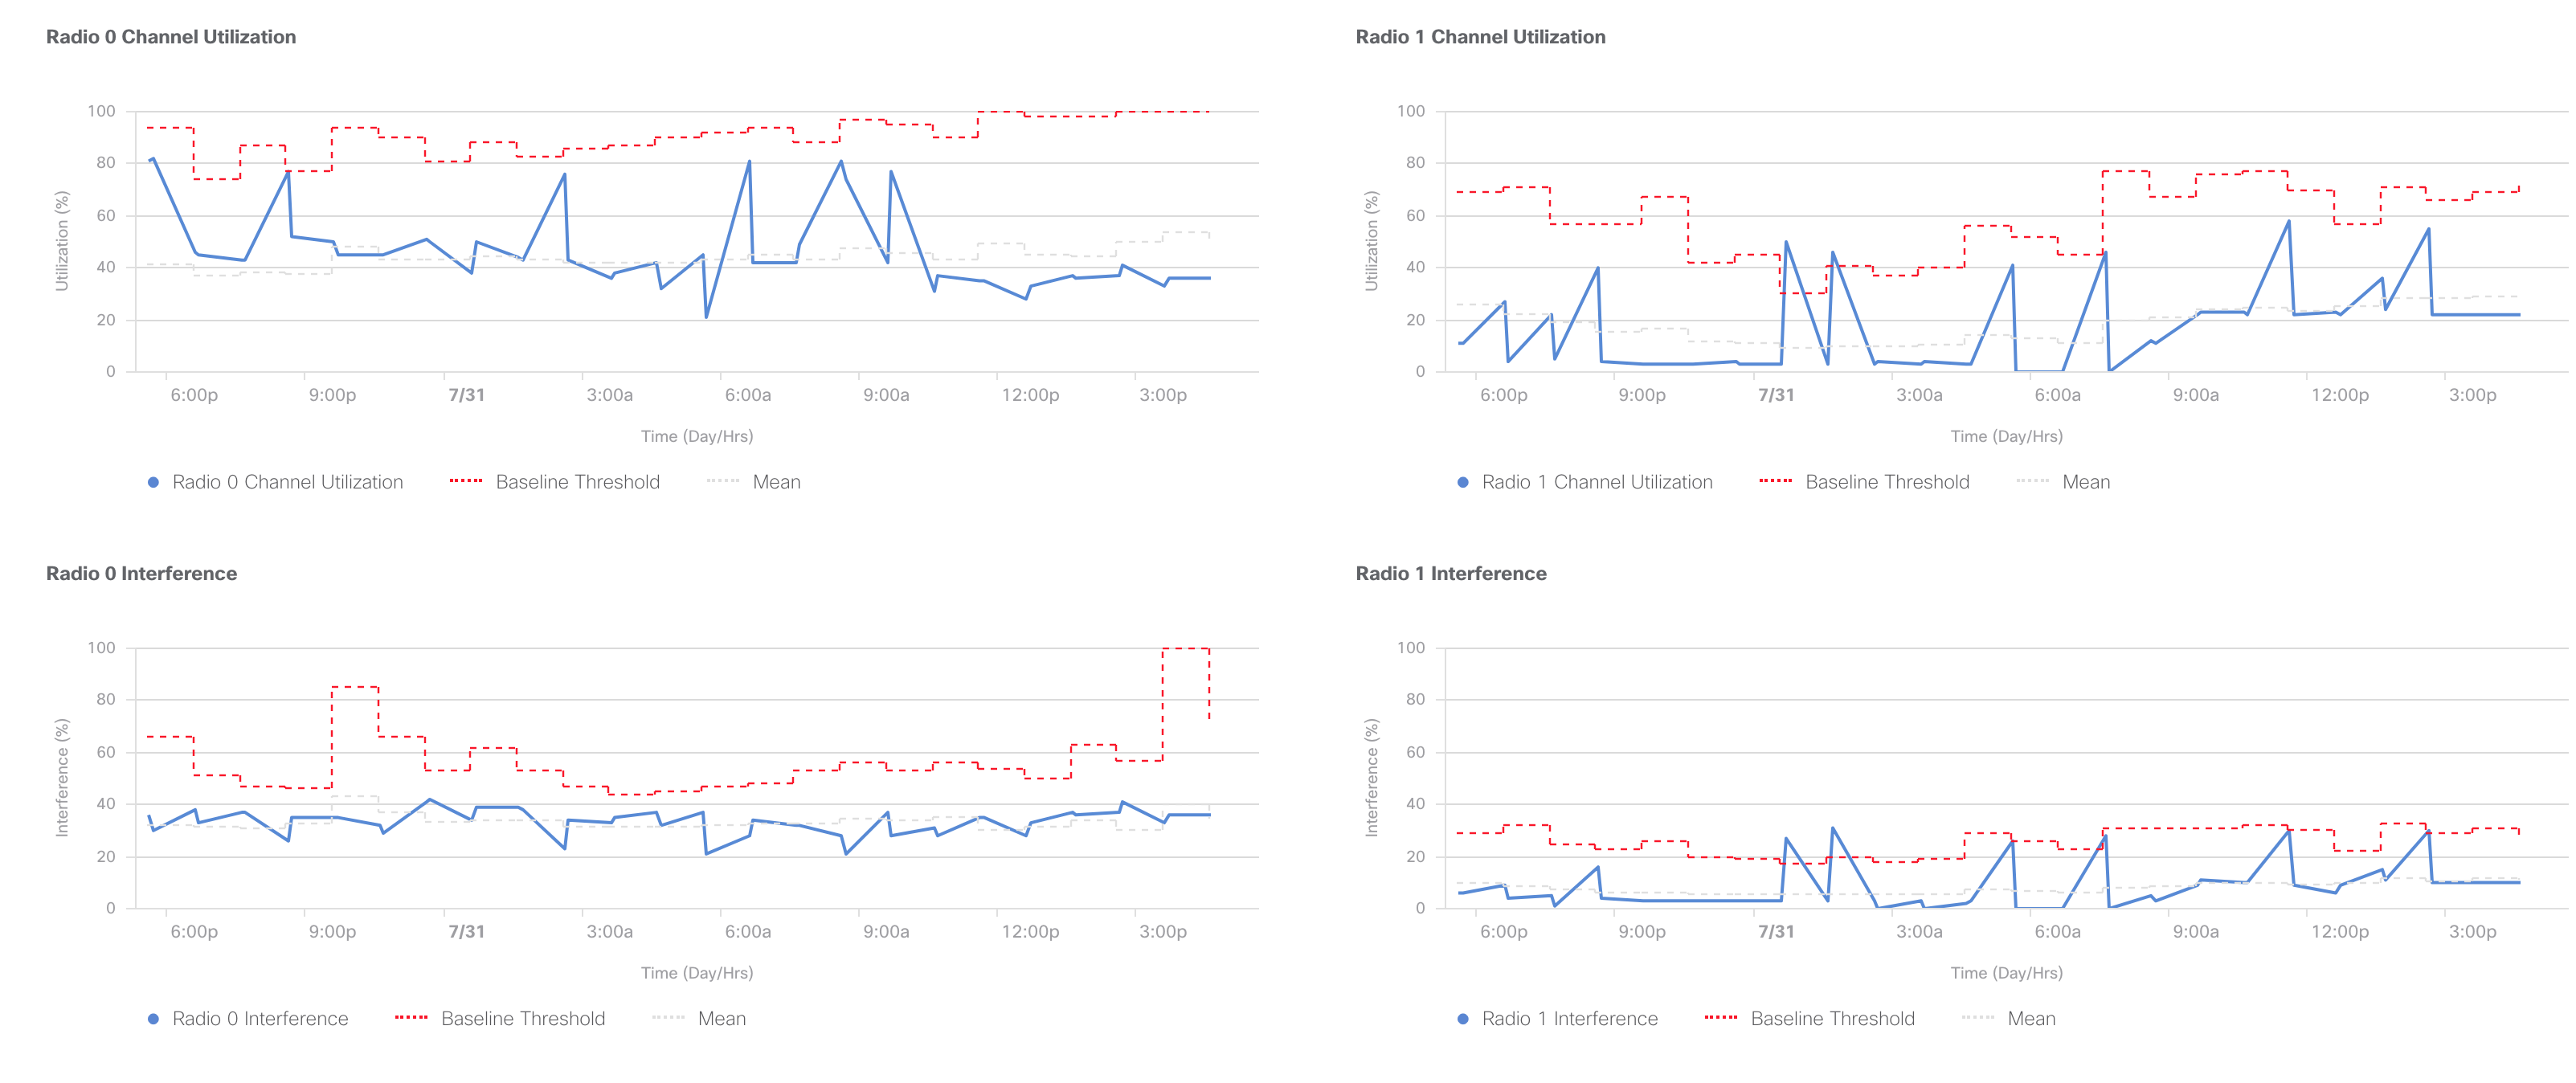
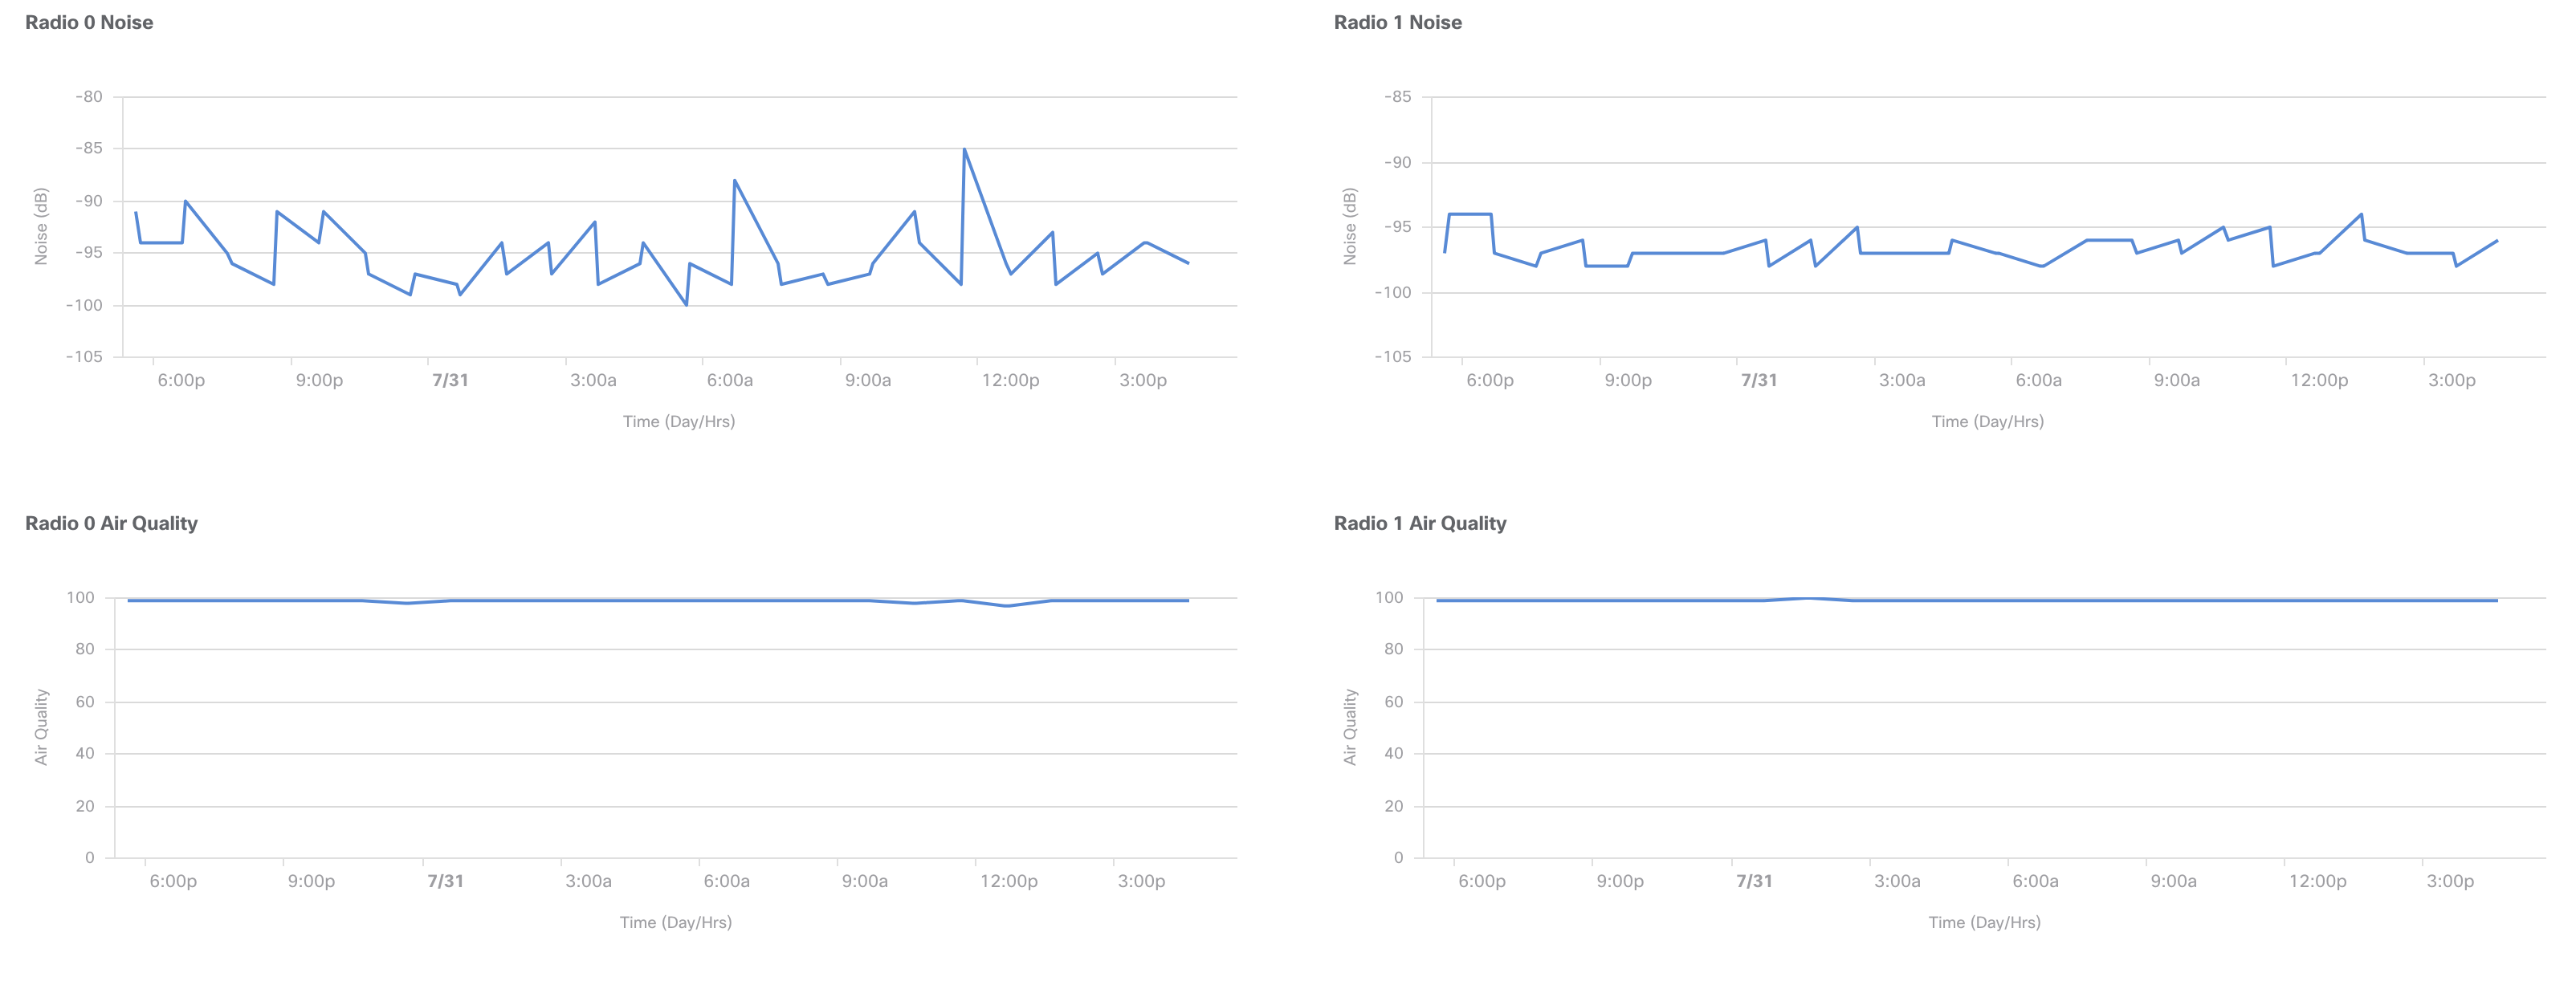
Scrolling down further will reveal the client details, and traffic/RF graphs over time.
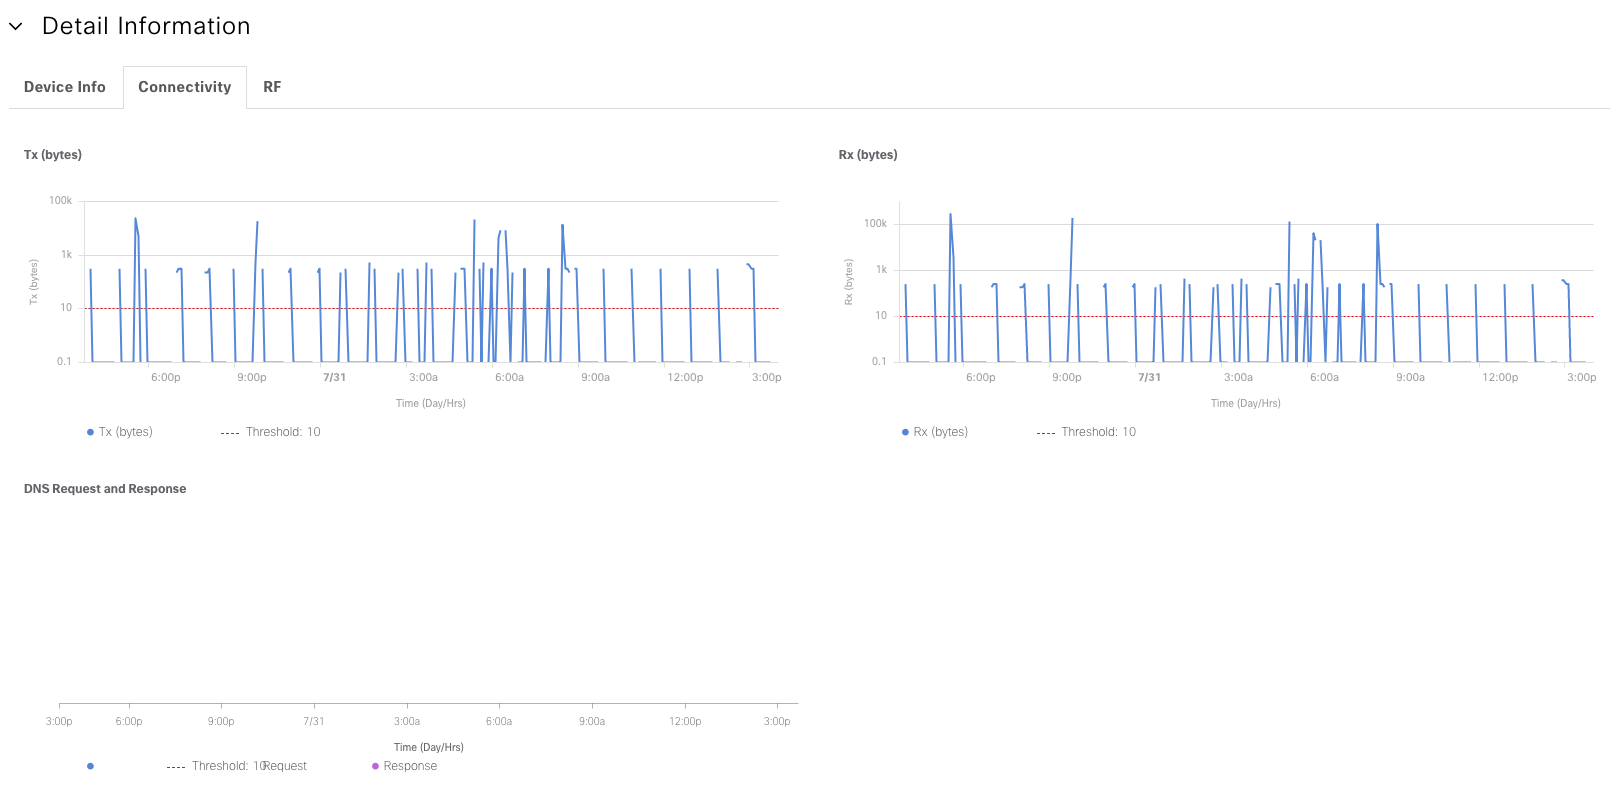
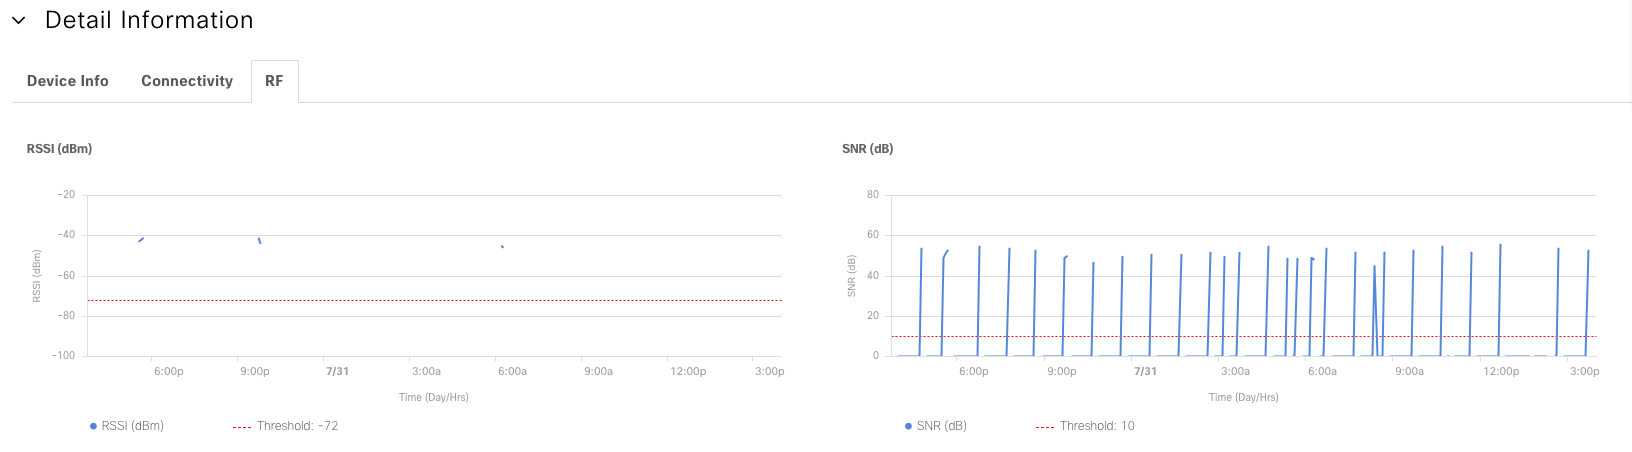
Those graphs aren’t particularly interesting for this client, because of the very little amount of network traffic this client generates. Here are some examples of more interesting client graphs (with a more active client):
Network Health
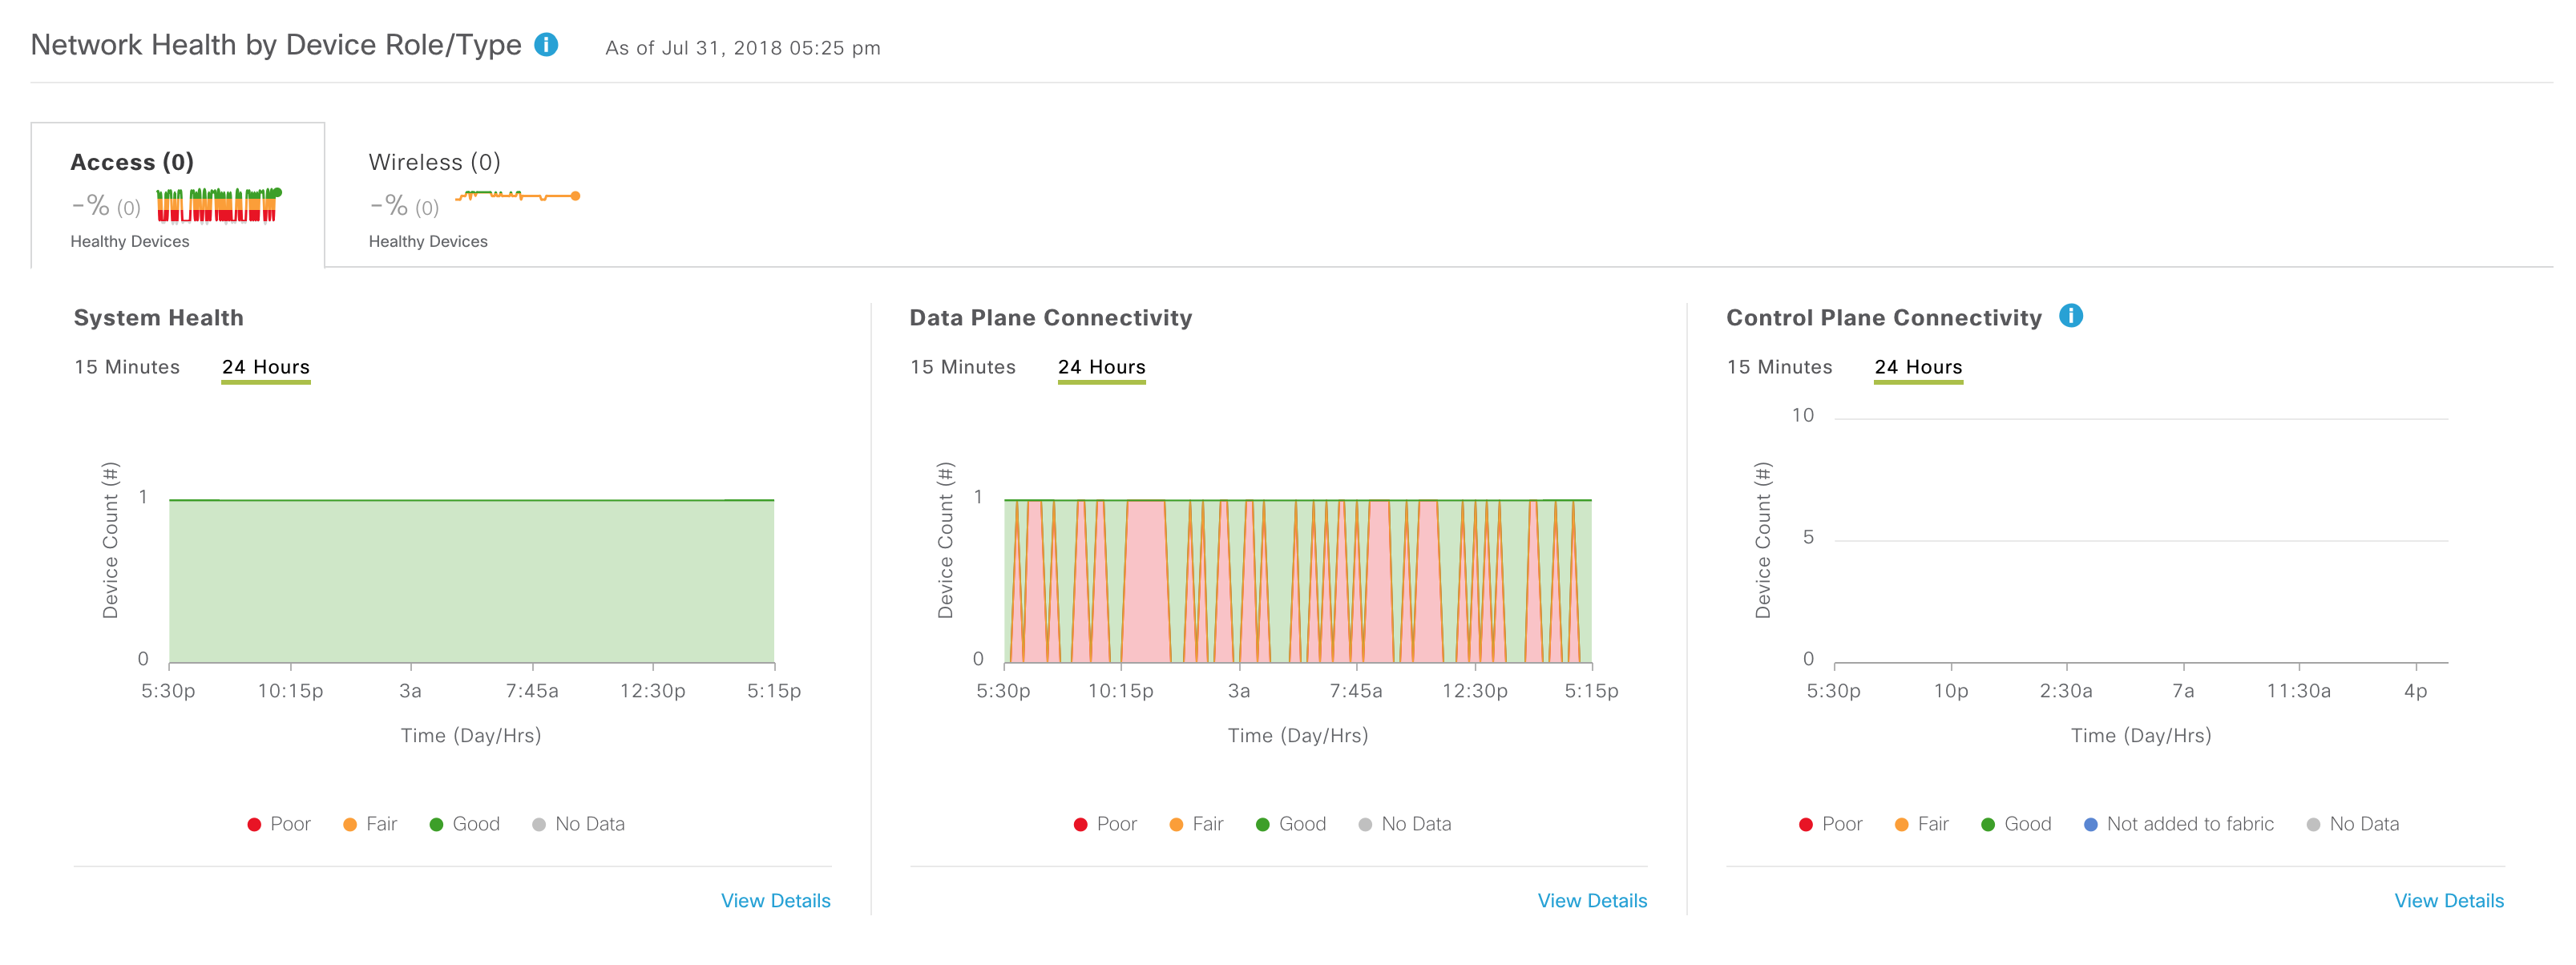
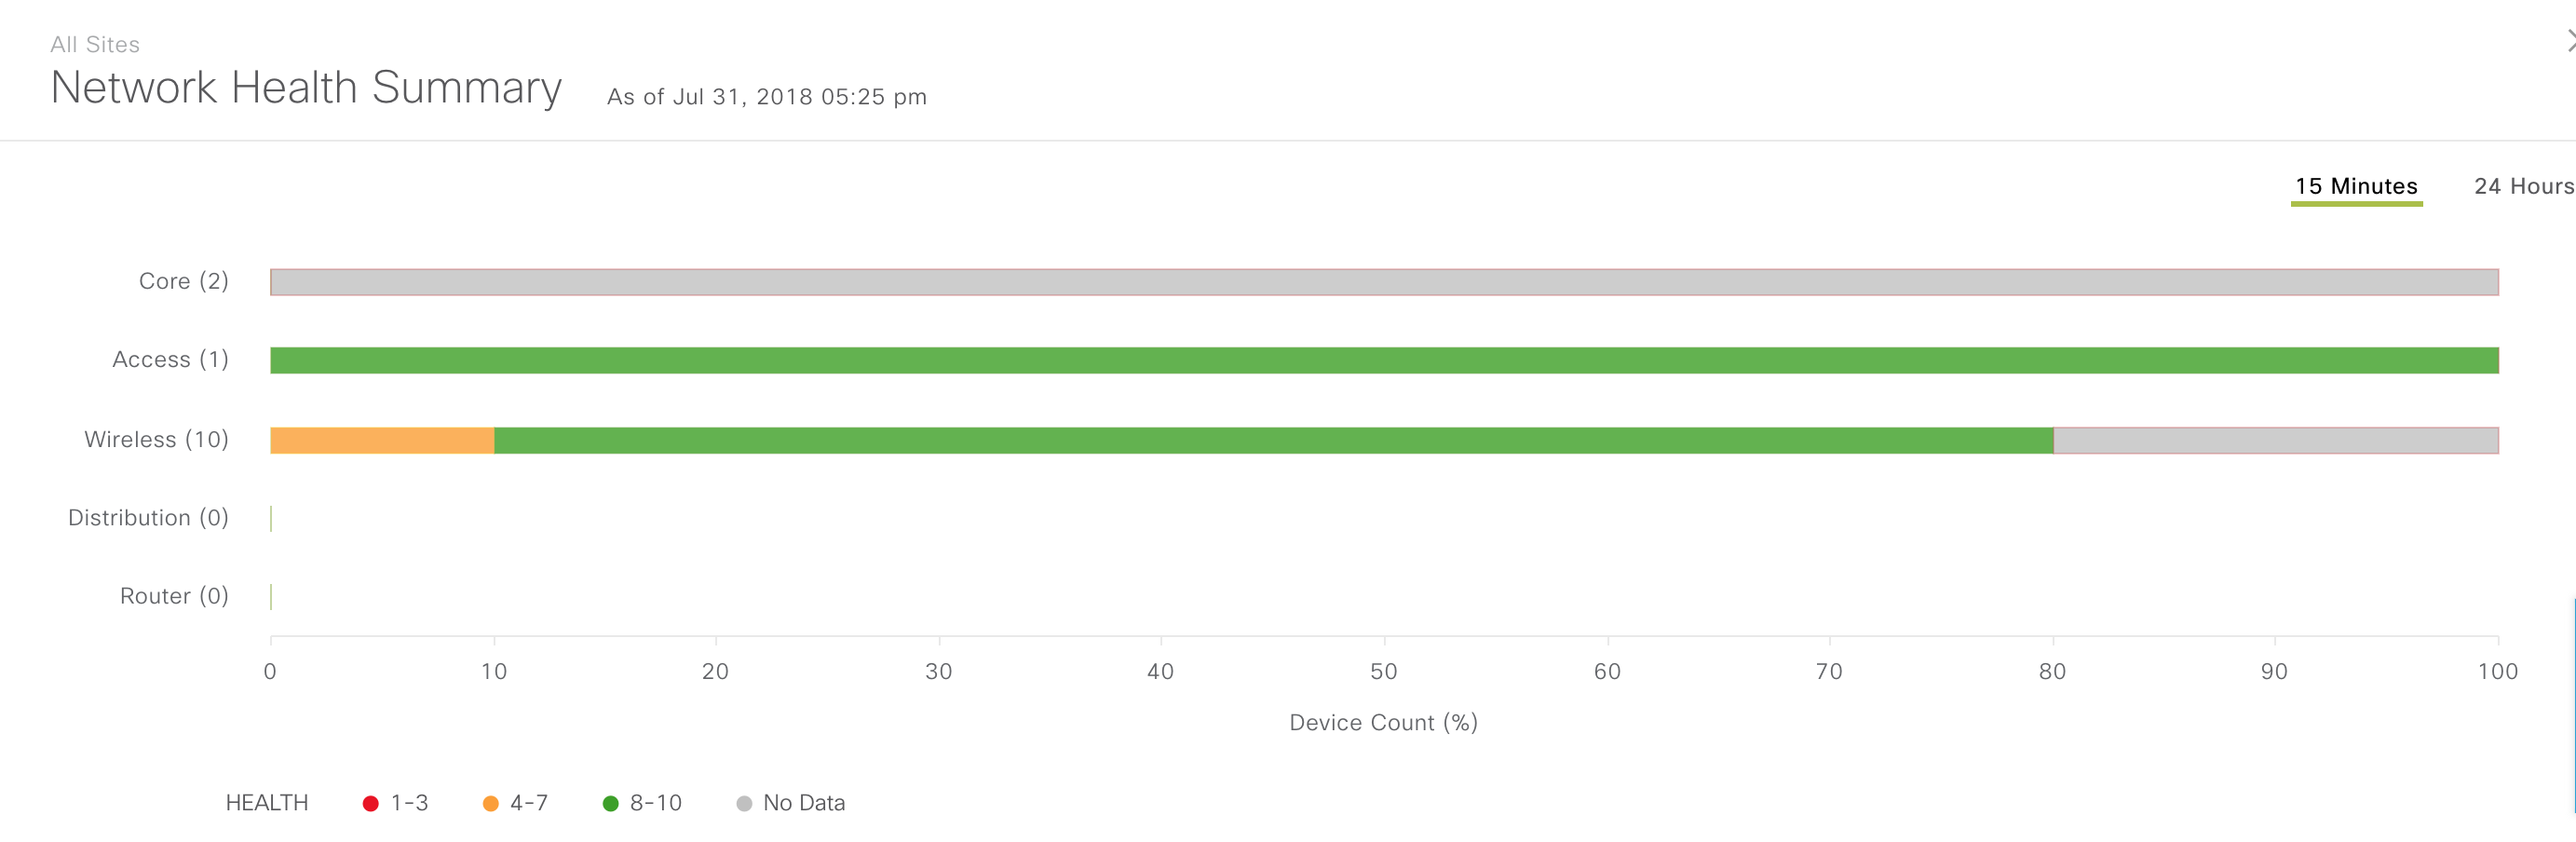
Network Health is similar to Client Health, but it shows the health of the devices and physical connections/links on your network. While helpful, I find that the scores get degraded too significantly for fairly small issues. For instance, the Network Health of my switch can be reduced from 10 to 1 by simply having one access port flap, or take on errors. Here are some examples of Network Health metrics:
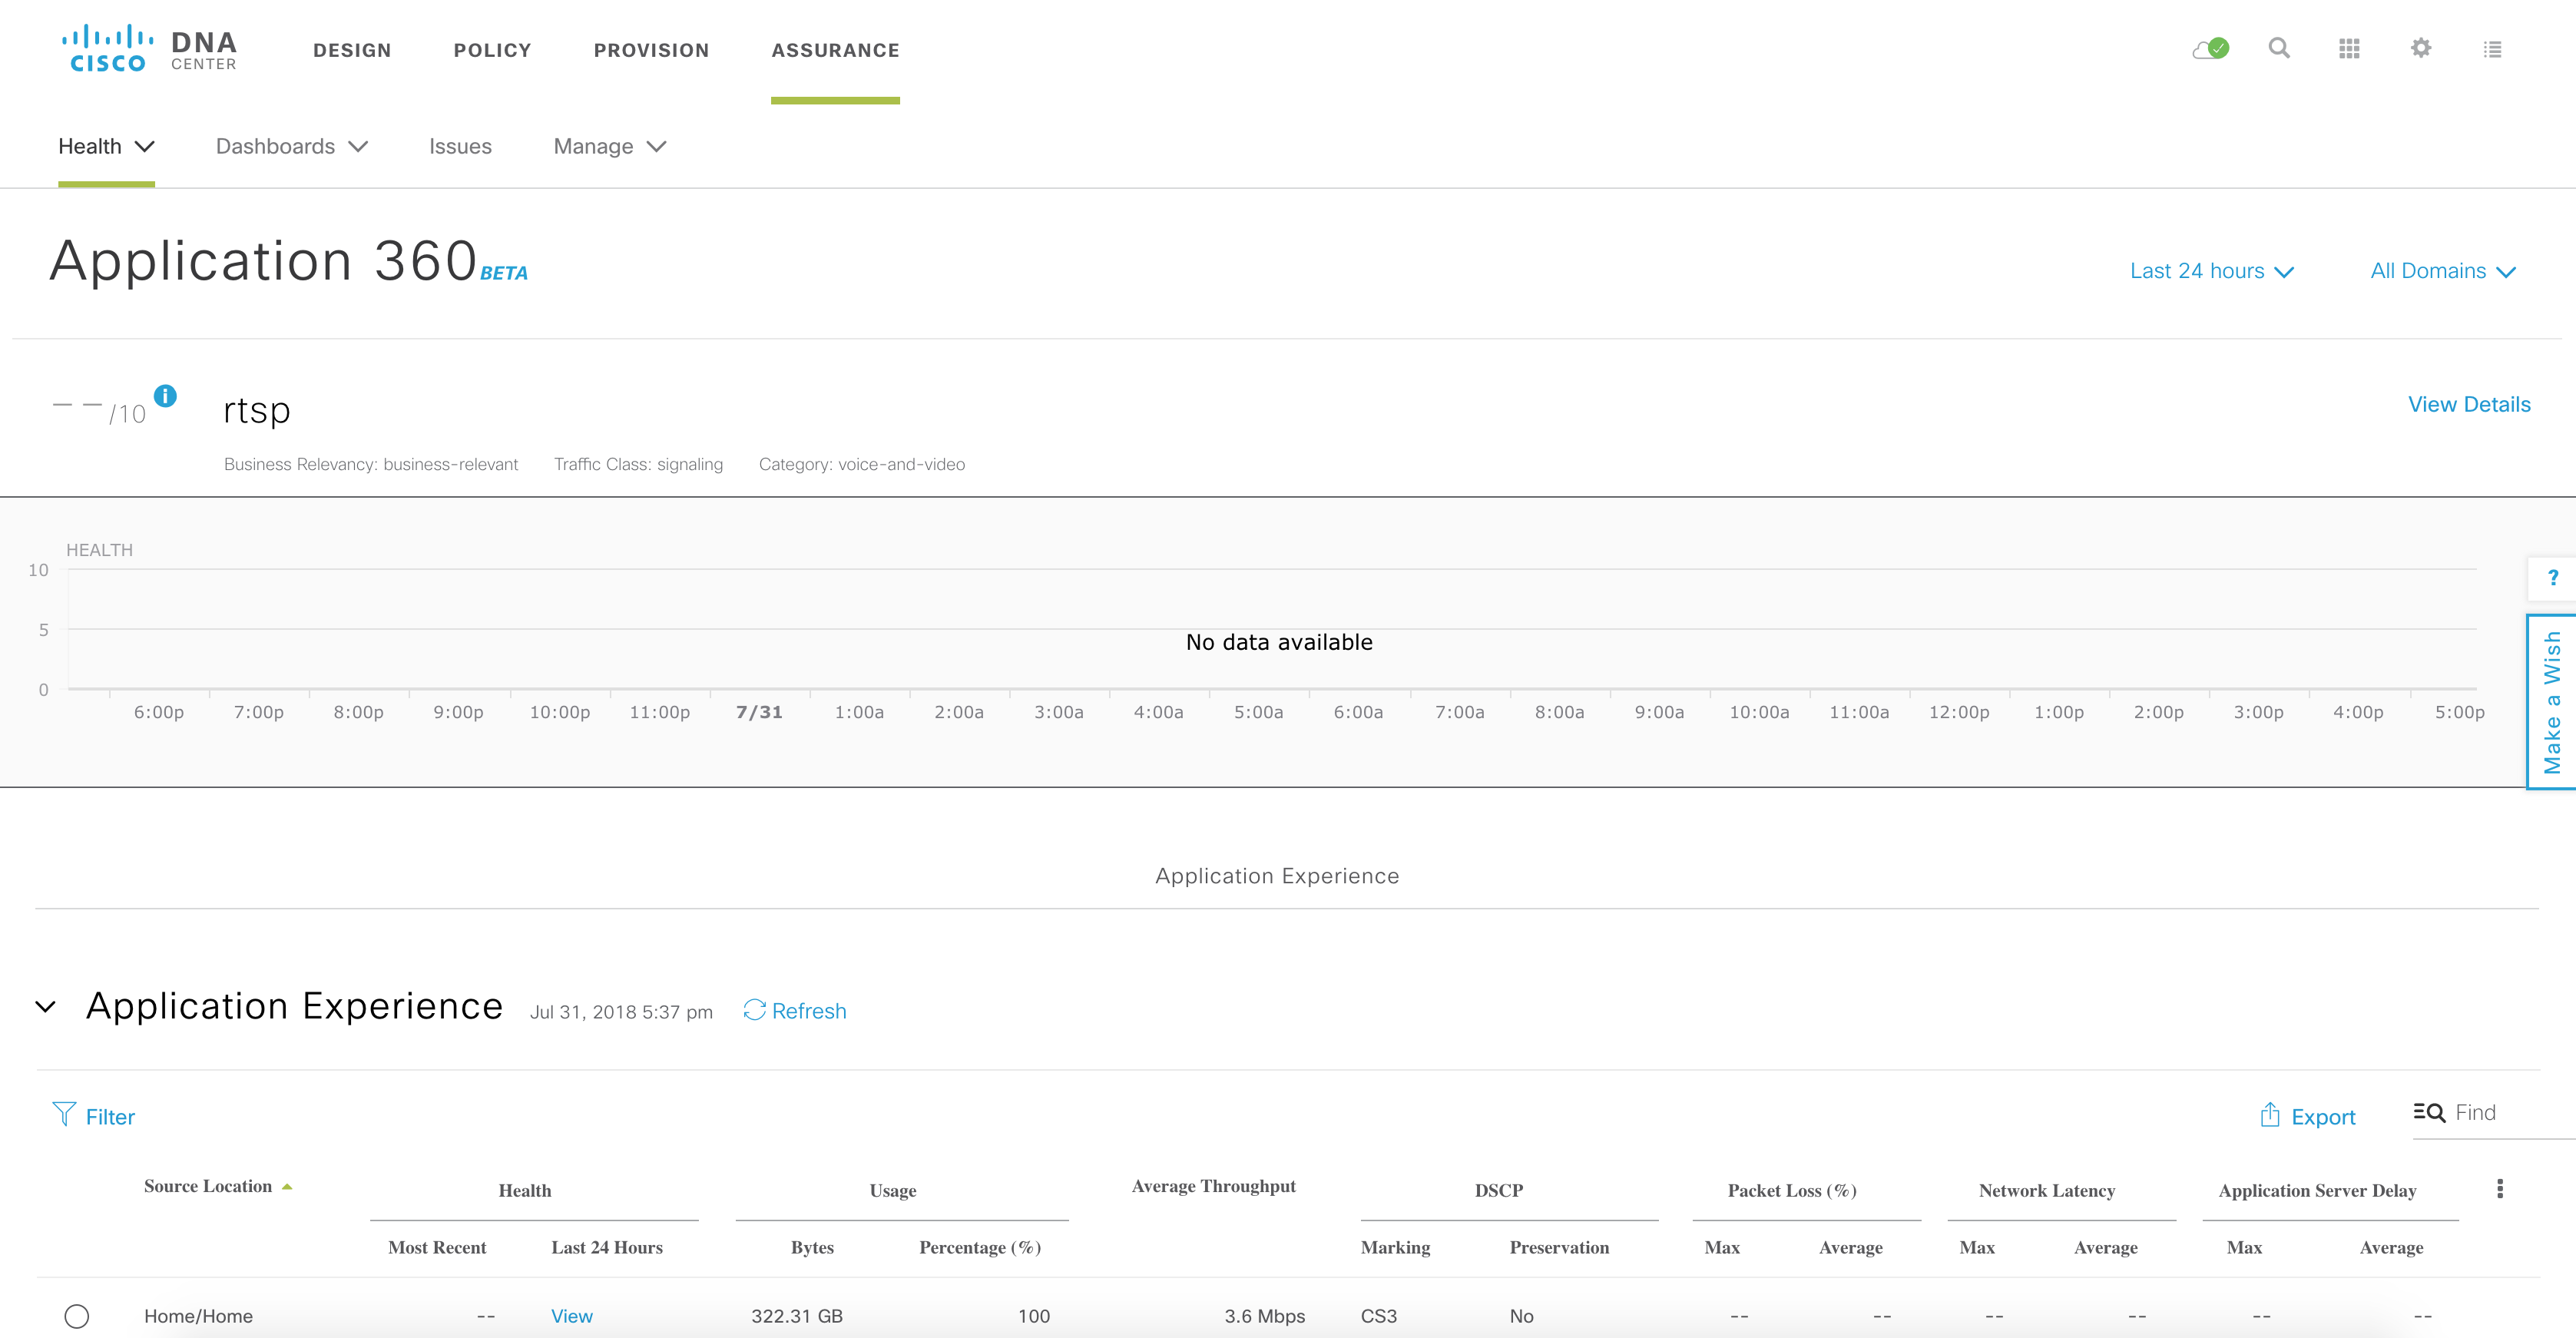
Application Health
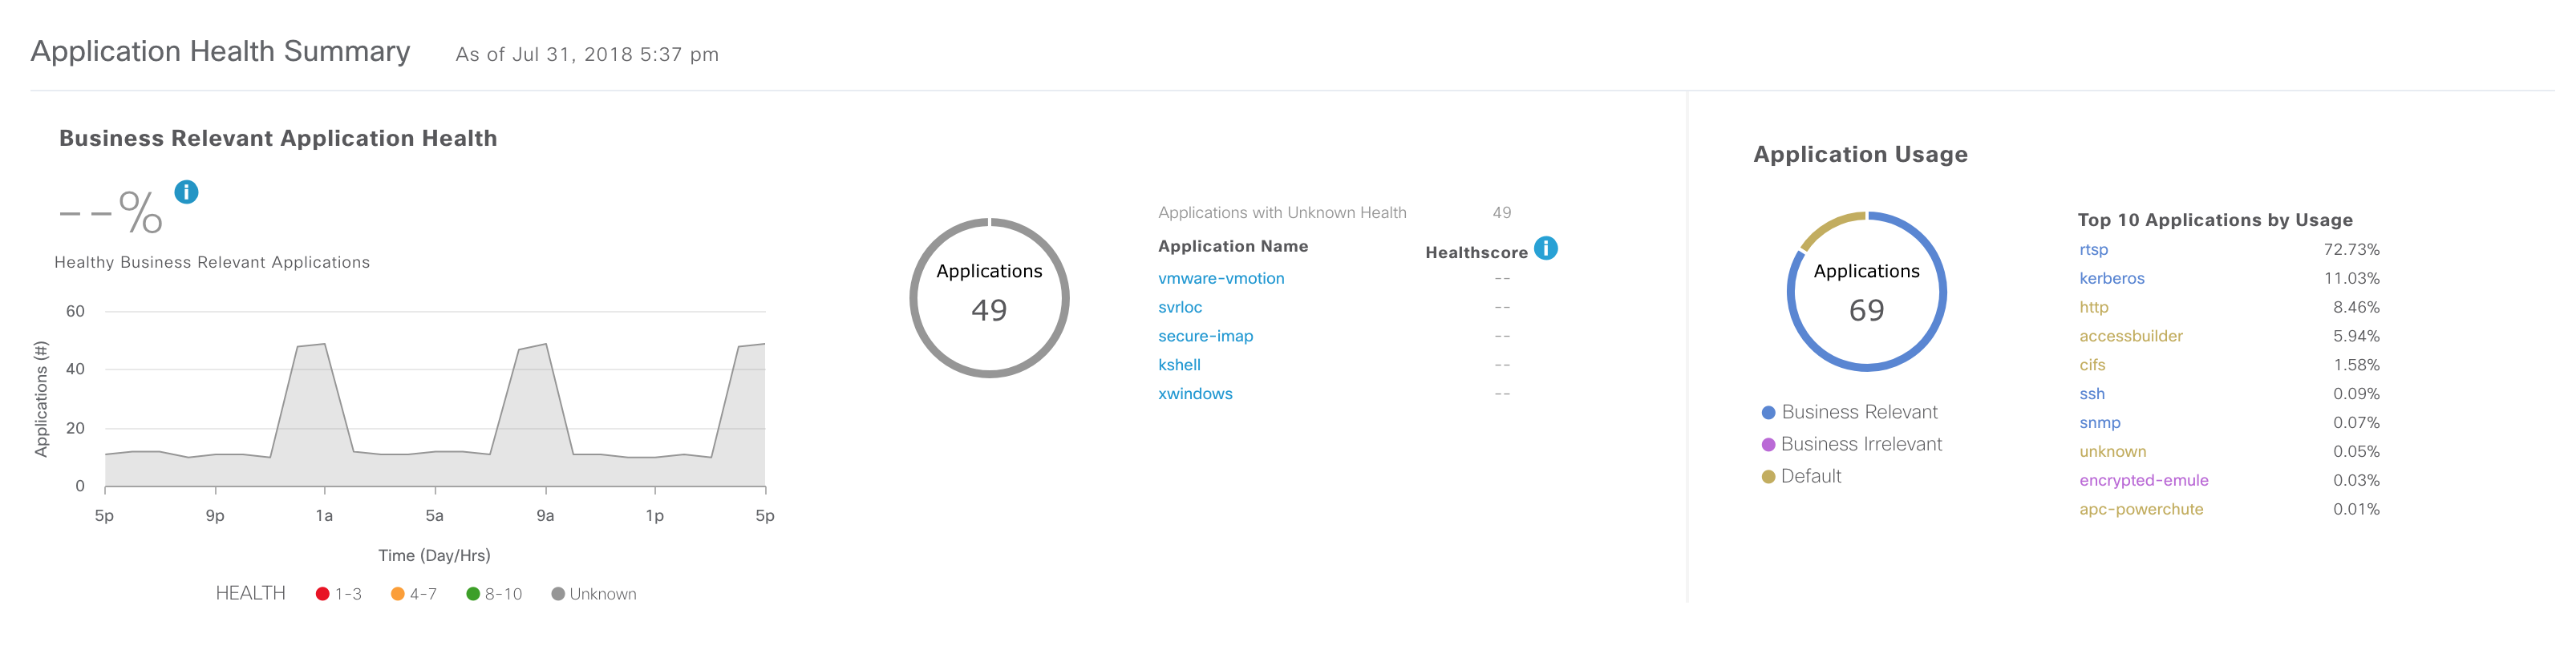
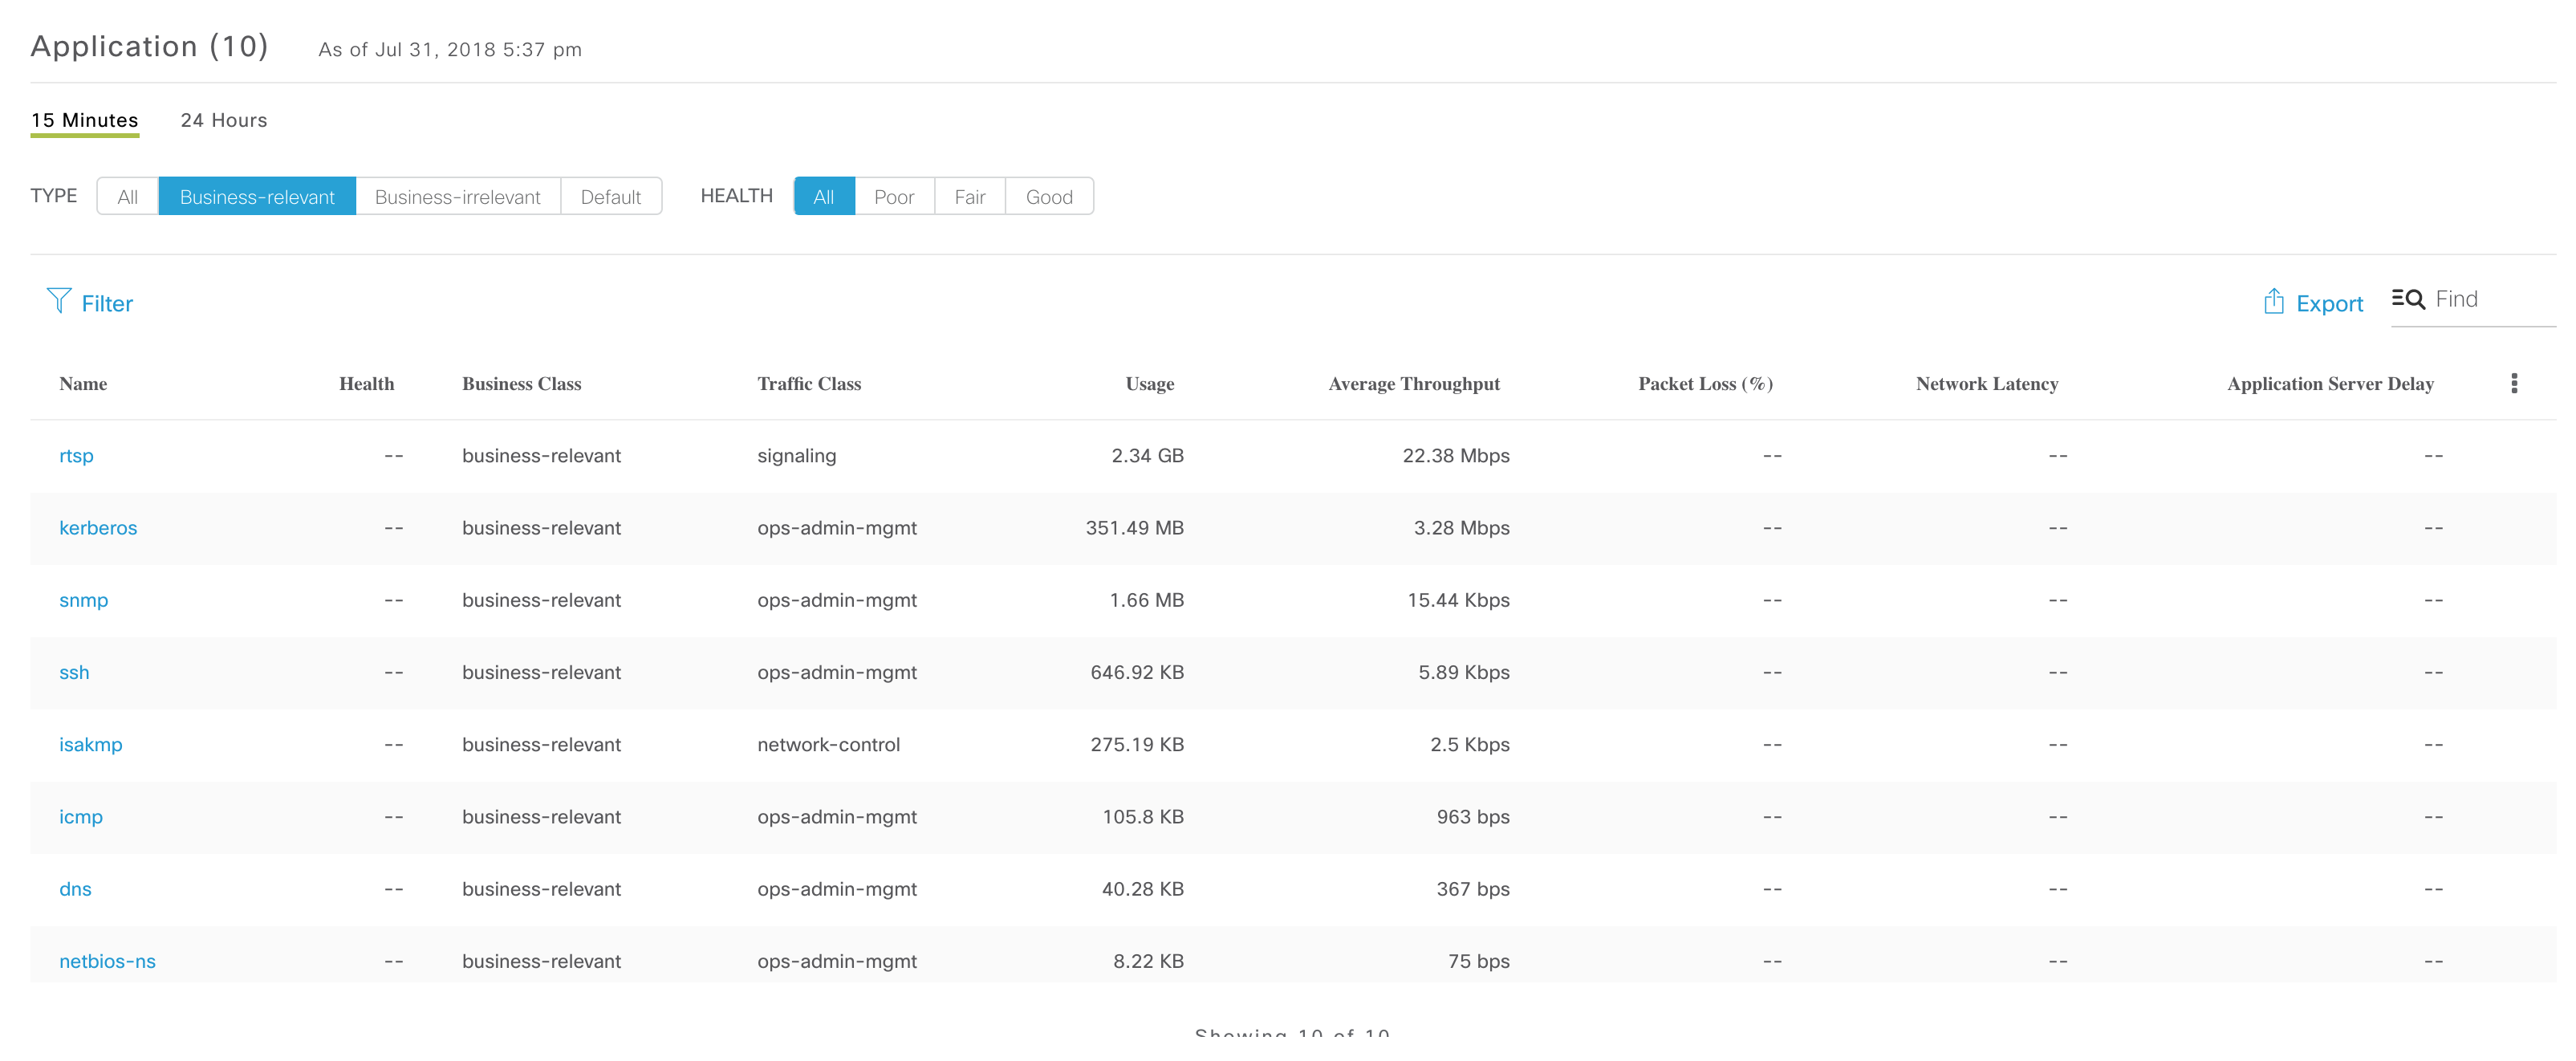
Application Health is where you can view your Netflow-style charts and graphs, for the applications flowing on your network. You can also create policies that define the allowable latency, throughput etc. for a particular application. Based on that information, DNA Center will generate a score for your applications. Unfortunately, I have been having some issues with this part of DNA Center, and I am working with Cisco TAC to resolve them. As a result, my data here is somewhat incomplete and potentially inaccurate. However, I’ll do my best to show you some of what DNA Center is capable of in this department.
Assurance Sensors and Sensor-Based Tests
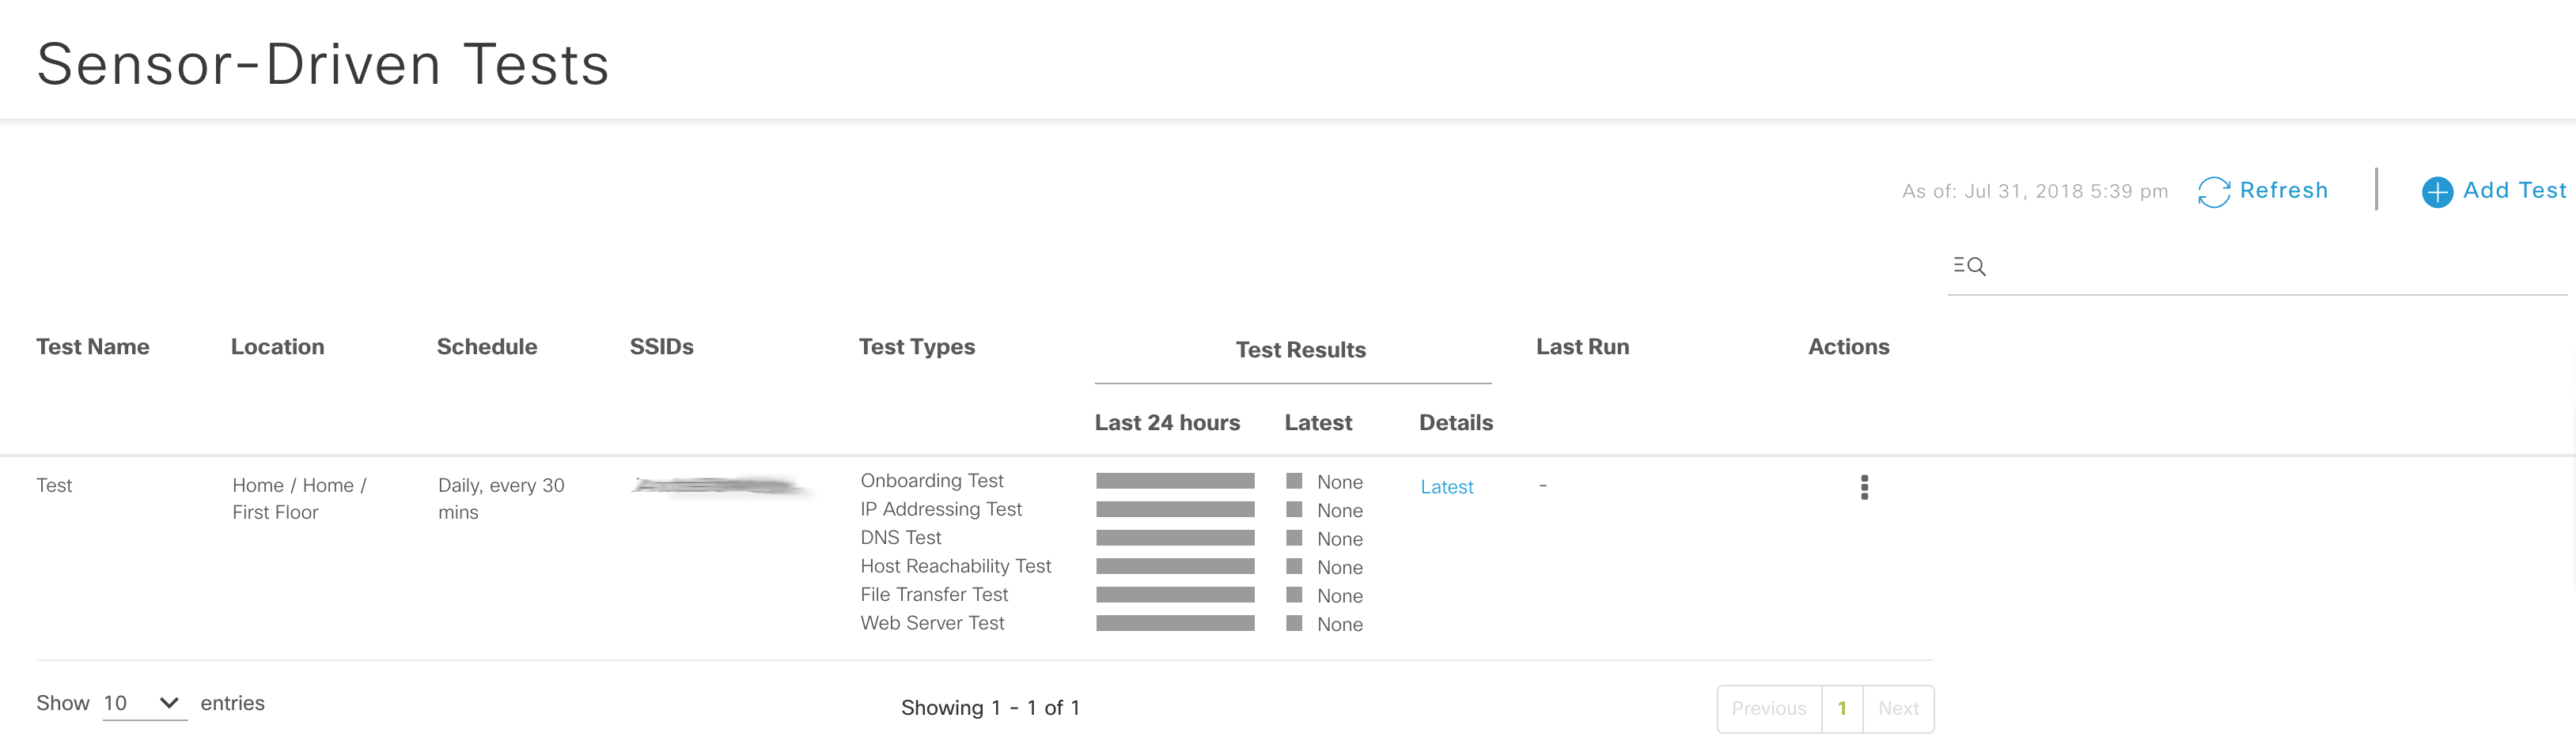
DNA Center, in combination with 1800S Sensors or AP1815s in Sensor Mode, is capable of some pretty impressive things. A Sensor (or AP in Sensor Mode) can be configured to connect to the wireless infrastructure as a wireless client, and run very specific tests. It can measure metrics from those tests and report on the results. This is the part of DNA Center that I am perhaps most excited about. Unfortunately, this is also another area of the application that I am having some issues. Cisco has helped to identify the cause of the issues, but we have not yet worked out a resolution. I will show you what I can, but at this point I have very limited visibility into the Sensor-Based tests.
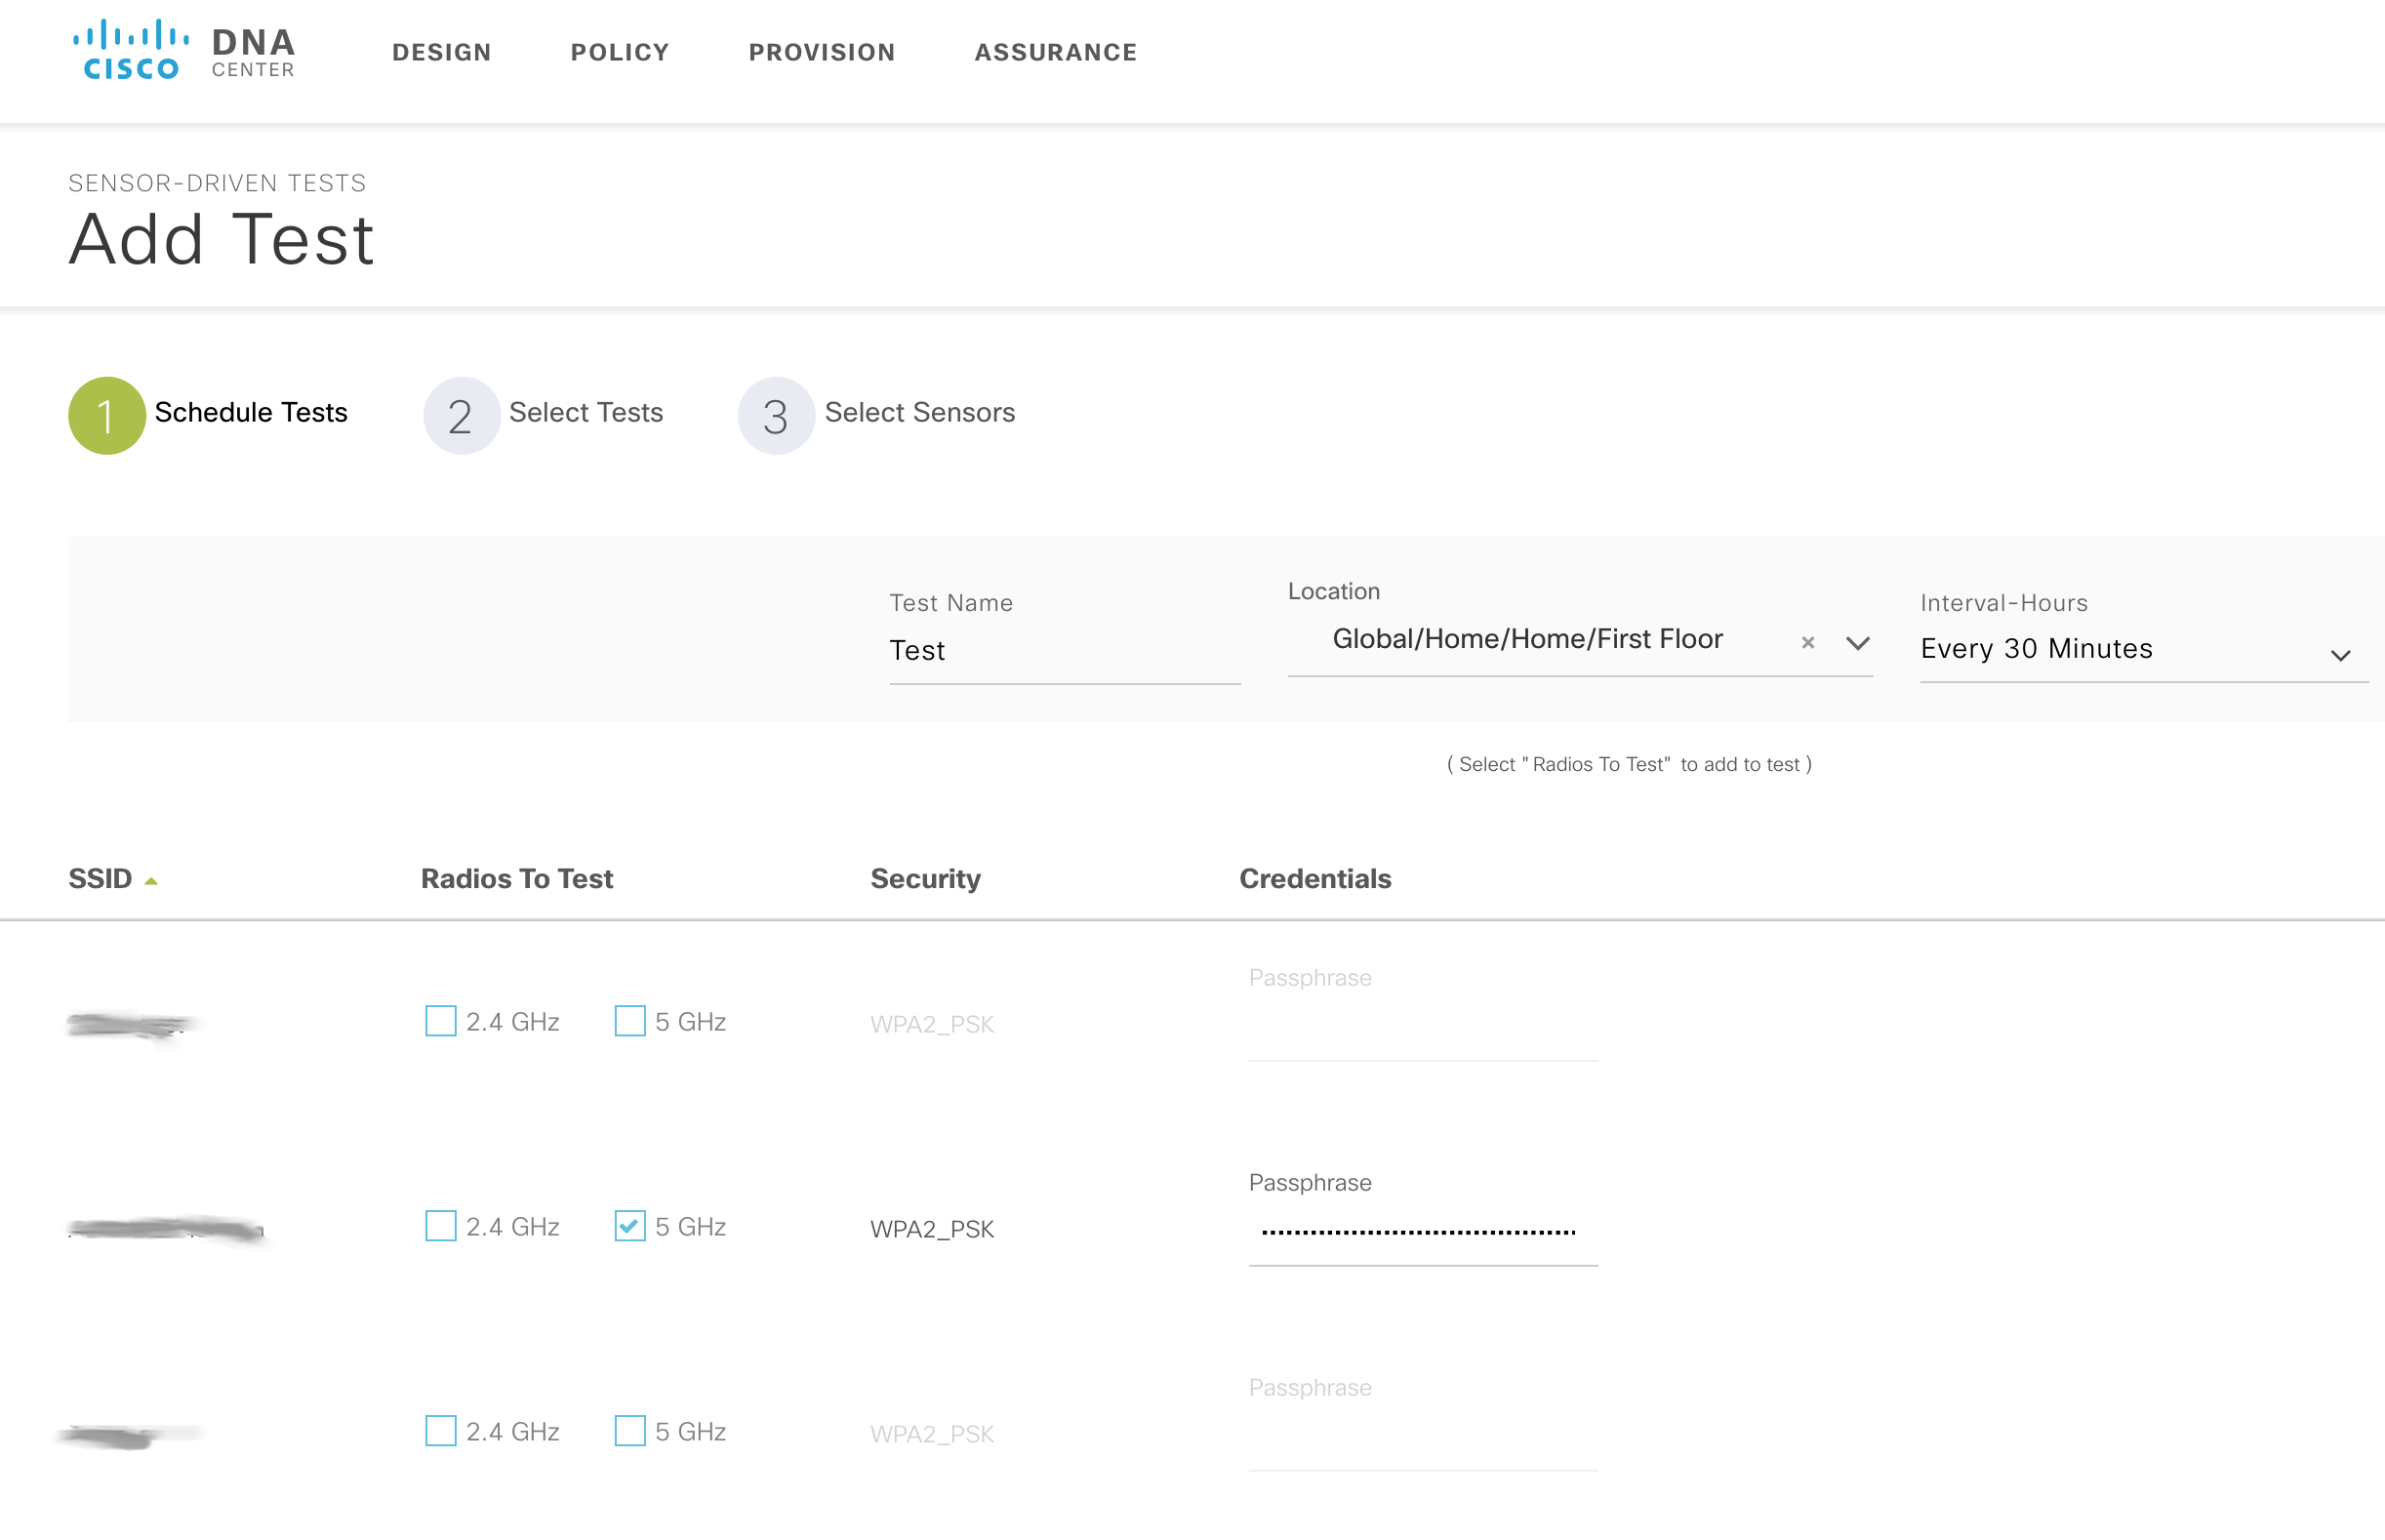
Sensors can be configured to run a battery of tests on a network. All of these tests are optional, and most have configurable parameters. This is another place where the network hierarchy comes into play. You could conceivably have different tests for different floors of each building, if you wanted to. You could then get the results of those tests shown to you by floor, building or area. Below are some examples of some test parameters:
- First, you choose the band (2.4GHz or 5GHz), the SSID, and the authentication method
- Next you choose the location for the test (down to the floor of a building)
- Choose the interval at which you want the test to run. Optionally, you can configure a one-time test that does not have a recurring schedule.
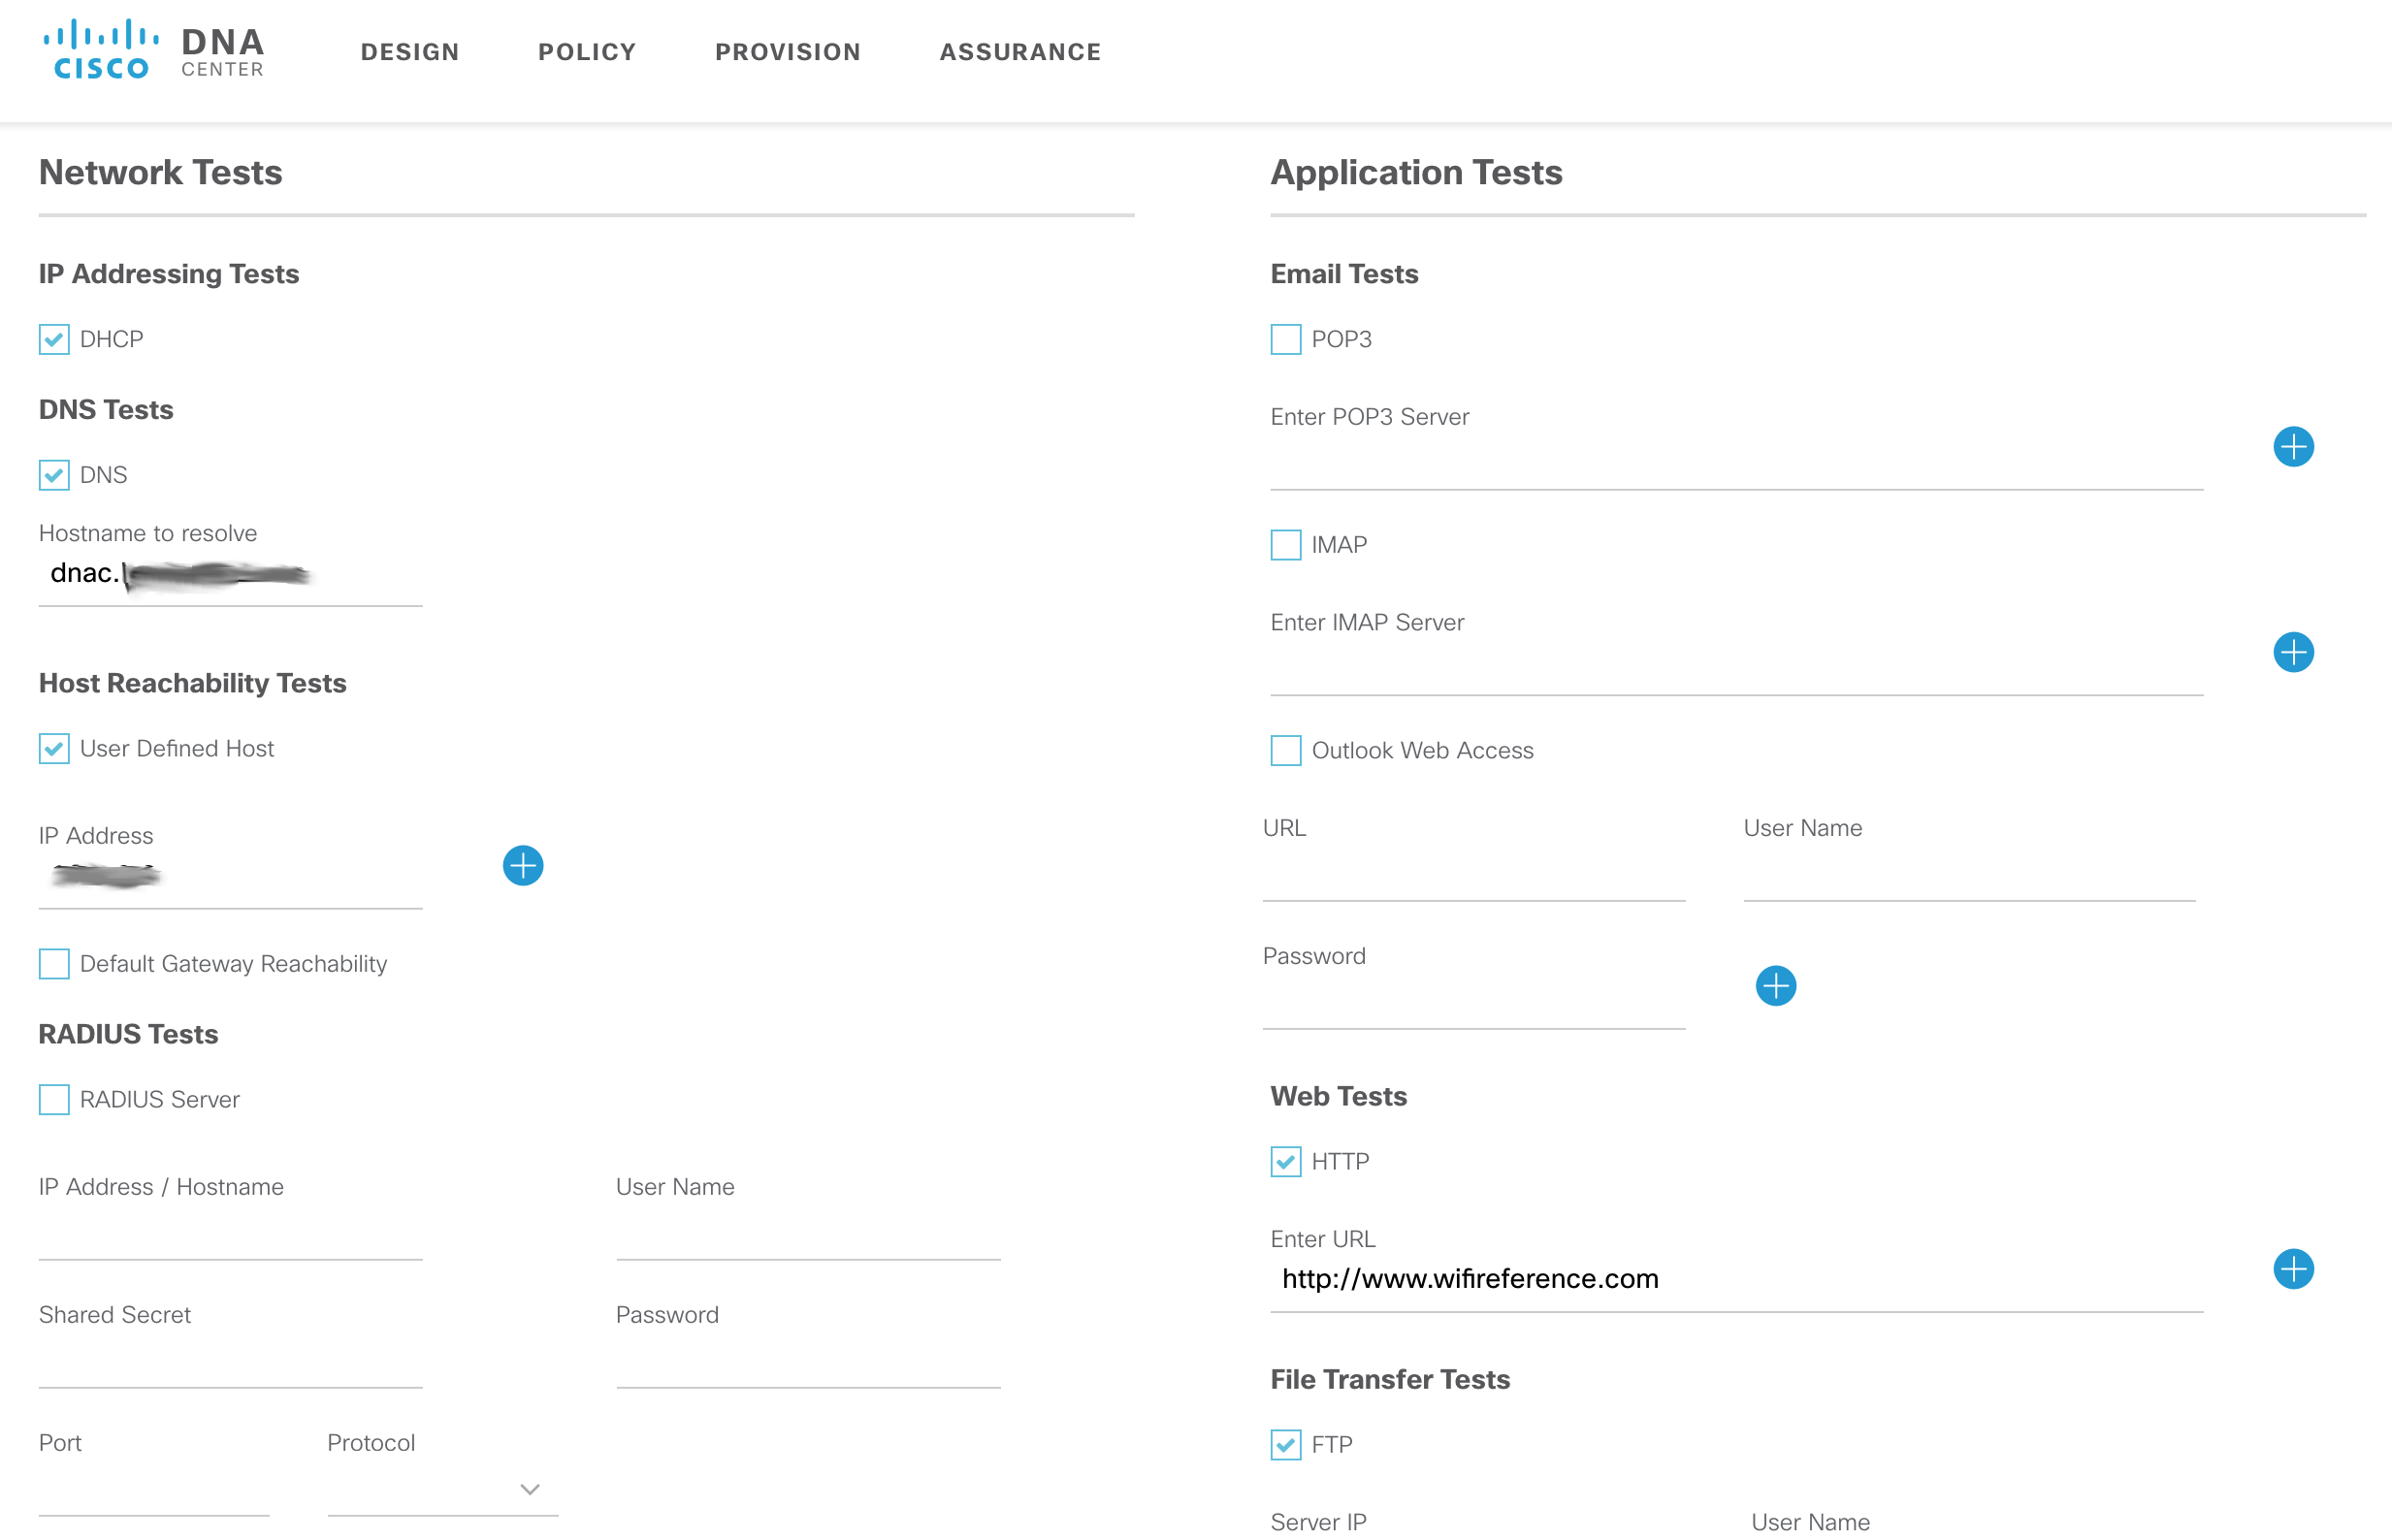
- Now you choose what you want the tests to do. Here are some example tests:
- Network Tests
- DHCP – Checks to see if the client can lease an IP and measures how long each step in the process takes
- DNS – Resolves a hostname of your choosing and measures how long it takes to resolve
- Host reachability – ICMP reachability to a host of your choosing
- Default Gateway Reachability – ICMP reachability of the default gateway
- RADIUS – Perform a RADIUS authentication test to a RADIUS server of your choosing (does not need to be otherwise configured in the system). You can choose the user, password, ip, shared secret, port and protocol for the test
- Application Tests
- Email – POP3, IMAP, Outlook Web Access
- Web – You configure the URL
- FTP – Upload/Download
- Network Tests
- Lastly, you choose the sensor that you want to run the tests. It shows you the neighboring APs to each sensor on your network, and the signal strength of each. This gives you a great idea of which APs will be used in the test.
There is an incredible amount of statistics that can be viewed for the results of these tests. Unfortunately, all of the data is blank for me right now, because I haven’t been able to run any tests. I’ll go into a bit of detail as to why the tests are not running for me:
I’m currently unable to run any Sensor-Based tests from my AP1815 because of a DNS issue in my lab environment. You may think that sounds like a simple resolution, but let me explain what’s actually going on. When an AP is in Sensor Mode, it inherits the URL of the DNAC Server from the management page in the WLC that I referenced earlier. The AP must be able to connect to that URL directly (not through the WLC). I installed a wildcard certificate on my DNAC Appliance, which means that in order to have a valid SSL session, you must connect to DNAC by its name (not its IP address). As a result, my DNAC URL, as configured in the WLC, is referencing the name of the server instead of its IP address. Unfortunately, in my environment, my AP1815 is unable to resolve anything with DNS. Cisco is trying to determine why this is the case. My other Cisco Wave 2 APs have the same problem, but I am able to resolve names with my Wave 1 APs without an issue. Since the Wave 1 and Wave 2 APs run different operating systems, it makes sense that they would behave differently. However, it’s pretty clear that they should both be able to resolve DNS entries. The failed connection from the AP to the DNA Center Appliance can be verified by running the following command on the AP:
AP_1815#show dot11 sensor stats
## Network Assurance Sensor Statistics ##
WSA Status: Enabled
NA Connectivity: Not Connected
NA Connectivity I/F: Radio 0 http
NA Server URL: https://dnac.myhouse.com
In this case, “NA” stands for Network Assurance. Clearly my AP is unable to connect to the Network Assurance Server. As soon as I get this working, I will update the article with some actual information. In the meantime, all I can show you is some of the configuration screens for Sensor-Based tests.
Hopefully this gives you a decent overview of DNA Center’s Wireless capabilities. I will continually update this post as I work through the issues I am having. I’ll also update it as new features are released (hint: Intelligent Capture). Please let me know if there is a specific feature or function that you would like to see outlined, and I will be happy to add it to the post.
Thanks man, it is an amazing post.
I hope I do something like that soon.
A very nice and good walkthrough . And thank you for the “pitfalls” and solutions. 🙂
Now here a year later , is everything working ?
Especially application assurance and tests with the 1800s ?
Did your tac cases resolve in some bugIDs we can lookup ?
Yes, everything is working now. DNA Center has come a long way since this post. The 1800S Sensor dashboard has improved quite a bit, but I still think the visibility of the data could use some work.
Fantastic approach and explaining minimum detail.
Having some fun and games with DNAC and wireless myself and this post has put me on the path to progress! Thanks!
AP sensor is quite stable now …we are using 1.3.X version of DNAC in our environment , however fabric wide provisioning is still a concern for large network as it take plenty of time to carry out the task.
Sometimes DNAC is a little bit painfull to deploy, in my case i did reimage two times.
i see that there is more information about wireless than the wired network.
Is there any way to verify the Amount of Traffic per interface on switches?
Yes, this information is available. However, it is not very simple to get to (this isn’t really the focus of DNAC). You need to view the Assurance data, expand the details, select the interface tab, select the interface you want to view the information for, and then scroll down to see the graphs. It’s apparent that this is not the way Cisco wants you to view that data. Ideally, you will allow DNAC to establish its own baselines and then alert you if something goes out of the norm. In that case, the traffic graph will be brought to your attention without having to drill so deep into the interface.
It mentions that you need 8.7 on the WLC. I cannot find any information about this detail of information. Can you provide a link to help in this matter?
Having some issues with the 1800s with WiFi assurance sensor driven test. My boss does not want to upgrade and we have 8.5 on the WLC.
Actually, DNA Streaming Telemetry does exist in 8.5. It’s webhook telemetry (for 3rd party integration) that doesn’t get introduced until 8.7. I’ll update the document. Page 22 of this Cisco Live presentation breaks it down: https://www.ciscolive.com/c/dam/r/ciscolive/us/docs/2018/pdf/BRKEWN-2050.pdf
Thank you so much this is perfect.
Exactly what I was looking for
To get the best out of DNA what document or tutorial do you follow?
This is one of the best initial references I have come across on this Dave, thanks.
For the wirless client information that gets fed into DNA, does it matter if end users are connecting to an SSID in Flex Connect v Local Switchin mode?
Nope. Local or FlexConnect users have the same client information/statistics.
Excelente referencia del entrono y trabajo del DNA Center en una red Inalambrica.
This is awesome. Just what I needed to start DNA center in wireless infrastructure.